Figures & data
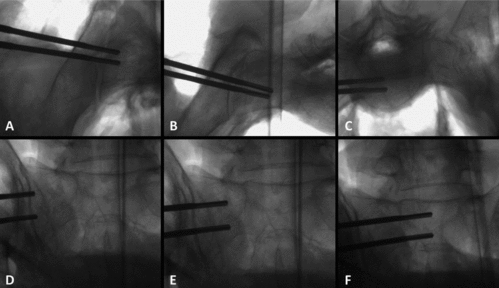
FIGURE 1 Radiographs obtained by use of a fluoroscan showing the both inserted Densiprobes at the measurement points (subcategories “superior” and “inferior”) on an inlet (A–C) or an outlet view (D–F) of the right hemipelvis at the level of the iliosacral joint (A, D), the lateral mass of the sacrum (B, E) and the center of the vertebral body of S1 (C, F).

FIGURE 2 Box and whisker plots show the values for the breakaway torque [in Nm] in pelves of human cadavers as measured at the iliosacral joint, the lateral mass of the sacrum or at the center of the vertebral body of S1. These measurement points were further divided in the subgroups “superior” and “inferior.” The horizontal line indicates the median value, the top and bottom borders of the box show the 75th and 25th percentiles, the whiskers show the 10th and 90th percentiles; differences with statistical significance are indicated with a p-value <.05 (*) or p-value <.01 (**).
![FIGURE 2 Box and whisker plots show the values for the breakaway torque [in Nm] in pelves of human cadavers as measured at the iliosacral joint, the lateral mass of the sacrum or at the center of the vertebral body of S1. These measurement points were further divided in the subgroups “superior” and “inferior.” The horizontal line indicates the median value, the top and bottom borders of the box show the 75th and 25th percentiles, the whiskers show the 10th and 90th percentiles; differences with statistical significance are indicated with a p-value <.05 (*) or p-value <.01 (**).](/cms/asset/b54b839e-e83f-4dc4-8546-a274077b884e/iivs_a_1016249_f0002_b.gif)
TABLE 1. Breakaway peak torque values (in Nm): Median (range) and mean ± SD in relation to the measurement points
