Figures & data
Figure 1. Risk assessment paradigm for inhalation exposure to ambient particles (adapted from NRC, 1998).
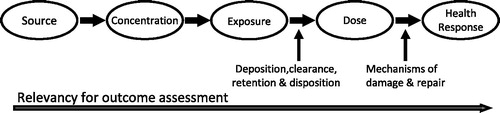
Figure 2. Disposition of smoke constituents from smoking article through the human body.
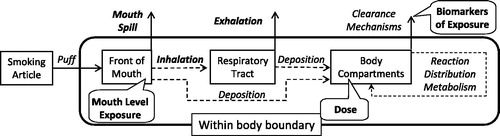
Table 1. Solanesol retention for studies with controlled inhalation volume and breath-hold times.
Figure 3. Respiratory retention versus log (vapor pressure). Individual data points shown as open diamonds. Solid squared are averages grouped by log(VP) rounded to an integer. The circled data are for solanesol.
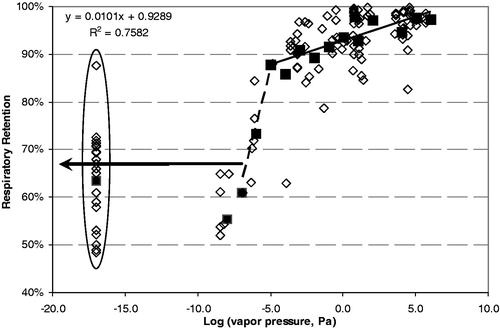
Table 2. Calculated respiratory retention for compounds used to estimate dose.
Figure 4. Histogram of estimated mouth-spill from subjects in Canadian and German clinical studies.
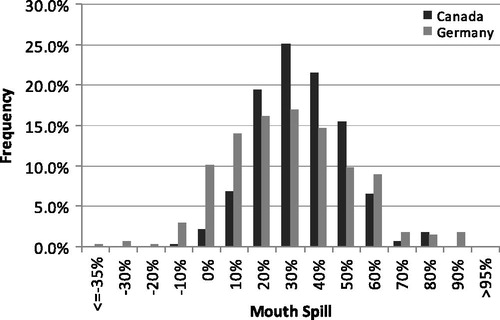
Table 3. Mouth-spill calculated by two methods for subjects in two clinical studies. Two replicates for 139 subjects in each study.
Figure 5. Carbonyl mouth level exposure (a) and dose (b) for the German clinical study.
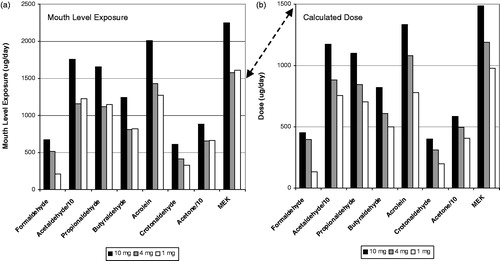
Figure 6. Tobacco-specific nitrosamine and pyrene mouth level exposure (a) and dose (b) for the German clinical study.
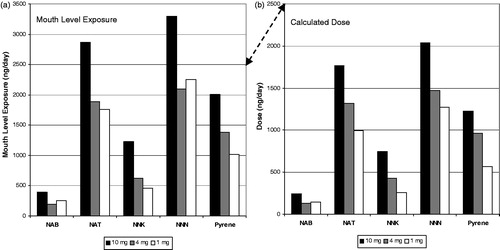
Figure 7. Carbonyl and pyrene mouth level exposure (a) and dose (b) for the Canadian clinical study.
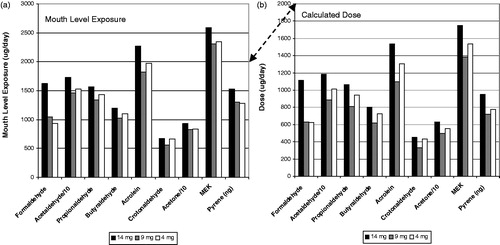
Figure 8. Correlation of urinary HPMA (expressed as acrolein equivalents) with acrolein MLE (a) and Dose (b).
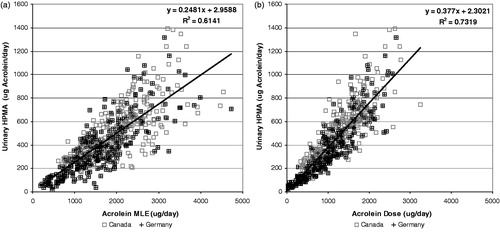
Figure 9. Correlation of urinary 1-hydroxypyrene (expressed as pyrene equivalents) with pyrene MLE (a) and Dose (b).
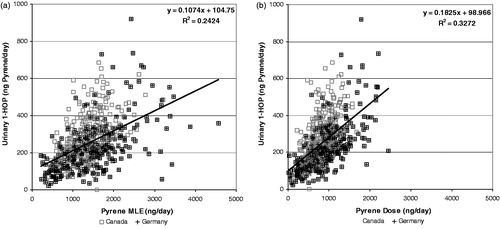
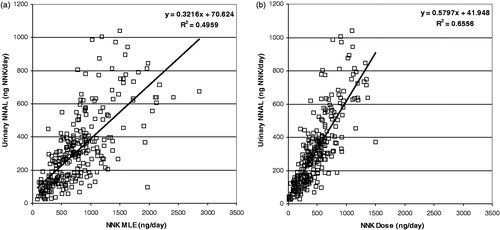
Figure 10. Correlation of urinary total NNAL (NNAL + glucuronide expressed as pyrene equivalents) with pyrene MLE (a) and Dose (b).