Figures & data
Table 1. Variable definitions.
Table 2. Correlation of AB/g as a function of (SEM AB/g) and F/g. Coefficients were utilized to calculate LAB, a combined function of AB/g, SEM AB/g and F/g, all in the same units of AB/g.
Figure 1. Correlation of a Rater’s Exposure Estimates with EXP.
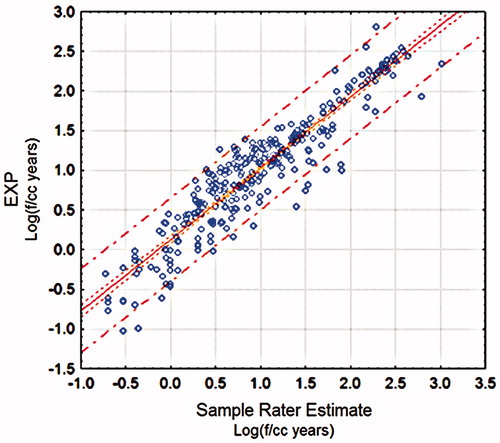
Figure 2. Residual error histogram with probit plot and quantile data for regression of a sample rater’s exposure estimates with EXP.
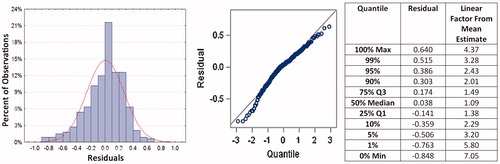
Table 3. Intraclass ICC for asbestos bodies and fiber burden analysis.
Table 4. Correlation of the logarithm of various lung asbestos body and fiber burden determinations with average log of rater estimates (EXP).
Figure 3. Correlation of LAB with EXP.
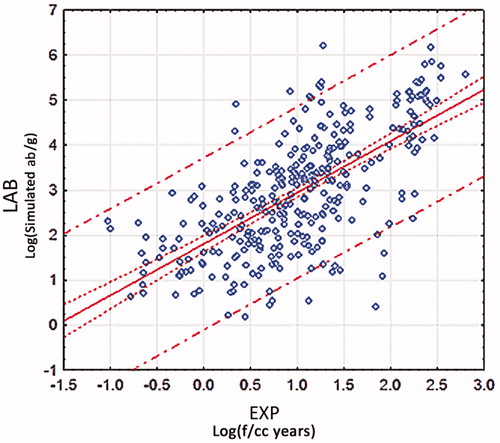
Figure 4. ANCOVA correlation of LAB as function of the continuous variable EXP and the class variable ET, no interaction term. Order of parallel lines from top: 1. Shipyard Insulator (n = 10), 2. Power Plant Worker (n = 7), 3. Asbestos Insulator (n = 41), 4. Shipyard Worker (n = 89), 5. Asbestos Manufacturing Except Friction Products (n = 5), 6. Secondary Household Exposures (n = 18), 7. Miscellaneous and Mixed Trade (n = 72), 8. Construction, Piping, and Boiler Trades Except Shipyard (n = 63), 9. Building Occupant (n = 5), 10. Refinery Workers (n = 6), and 11. Automobile and Friction Product Related (n = 11). Colors of data points correspond to the colors of the parallel lines.
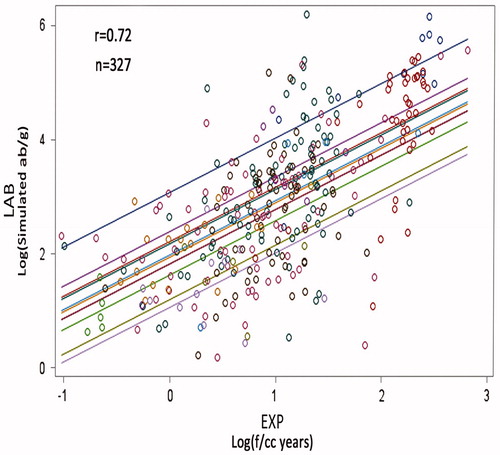
Table 5. Standard errors associated with the data presented in .
Figure 5. LAB as function of EXP and fiber for four fiber type classes (with interaction). 1. Commercial amphibole asbestos, majority fiber type, no chrysotile (+), n = 216 2. Commercial amphibole asbestos, majority fiber type, chrysotile detected (x), n = 30. 3. Amosite and/or crocidolite detected, but not majority asbestos fiber-type (o), n = 35. 4. No crocidolite or amosite detected (Δ), n = 40.
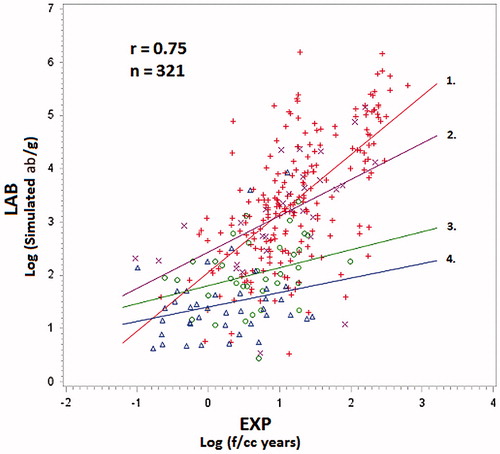
Figure 6. Comparison of asbestos body and asbestos fiber burden ANCOVA correlations.
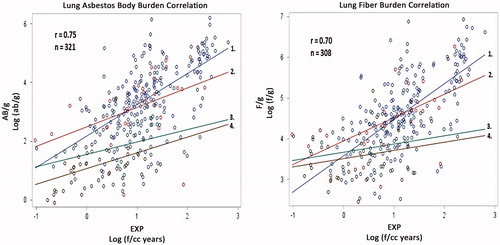
Table 6. Comparison of ANCOVA correlation with EXP and EXP*FT for each of the dependent variables, LAB, AB/g, and F/g.
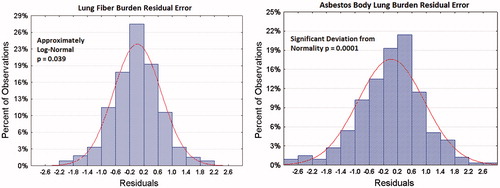
Figure 7. Residual error histograms for F/g and AB/g as a function of EXP, FT and EXP*FT.