Figures & data
Figure 1. Characterization of SWCNTs dispersed in working solutions. Characterization of SWCNTs in working solutions for in vivo and in vitro tests (A). TEM images of SWCNTs in CNT-1 (B and C) and CNT-2 (D and E) in working solutions for in vivo (high dose) studies. High-magnification micrographs (C and E). Distribution of SWCNT length in working solutions for in vivo (high dose) evaluation by digital TEM images (F and G).
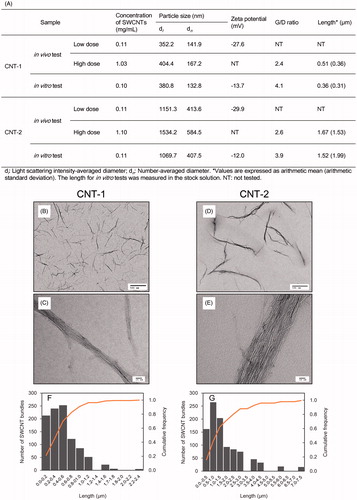
Figure 2. Total protein content and MIP-1α in BALFs following exposure of rats to CNT-1, CNT-2, or vehicle controls at the indicated time points. Total protein content (A) and the levels of MIP-1α (B) in the BALF following exposure of rats to CNT-1, CNT-2, or vehicle controls at each time point. Values are represented as the mean ± SD. The asterisk indicates a statistically significant difference compared to the vehicle control group (multiple permutation-based Welch test, *p < 0.05, **p < 0.01).
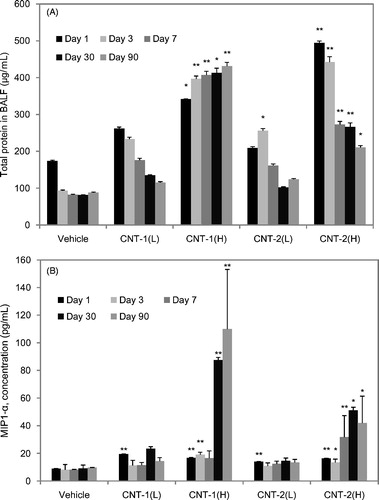
Figure 3. Cell counts in BALF following exposure of rats to CNT-1, CNT-2, or vehicle controls at each time point. Total nucleated cell (A), neutrophil (B), normal macrophage (C), and atypical macrophage (D) counts in BALF following exposure of rats to CNT-1, CNT-2, or vehicle controls at each time point. Values are represented as the mean ± SD (×103/mm3). Asterisk indicates a statistically significant difference compared to the vehicle control group (multiple permutation-based Welch test, *p < 0.05, **p < 0.01). Percentage of neutrophils, lymphocytes, eosinophils, normal macrophages, and atypical macrophages in BALF (E).
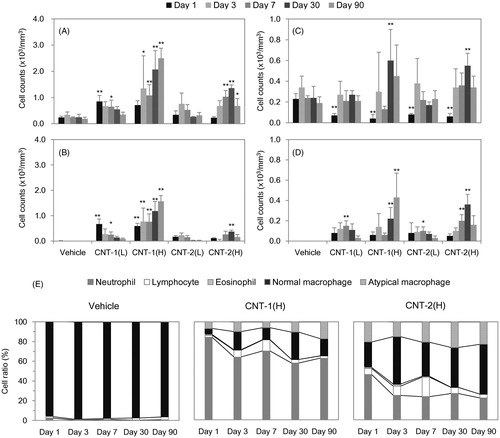
Figure 4. Anatomical observations after instillation with SWCNTs. Dissected lungs from a rat exposed to SWCNTs at 1 and 90 d post-instillation (A). The lungs were dissected at each time point post-instillation from groups of rats exposed to the vehicle control or a high dose of CNT-1 or CNT-2. Micrographs of lung tissue from rats exposed to CNT-1 or CNT-2 at a high dose at 1, 3, 7, 30, and 90 d post-instillation (B).
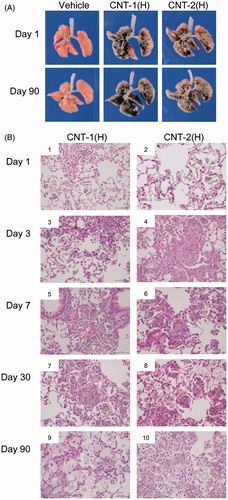
Table 1. Pulmonary histopathology severity scores of rats exposed to CNT-1 or CNT-2.
Figure 5. TEM images of mediastinal lymph nodes from rats exposed to CNT-1 or CNT-2 at a high dose at 90 d post-instillation. The mediastinal lymph nodes in the rats were fixed using 2.5% (v/v) glutaraldehyde for 2 h at 4 °C and 1% osmium oxide solution for 2 h at 4 °C, dehydrated in ethanol, and embedded in a commercially available epoxy resin. Samples were transferred to fresh resin in capsules and polymerized at 60 °C for 48 h. The TEM system was used to observe morphologic changes in the mediastinal lymph nodes of the rats.
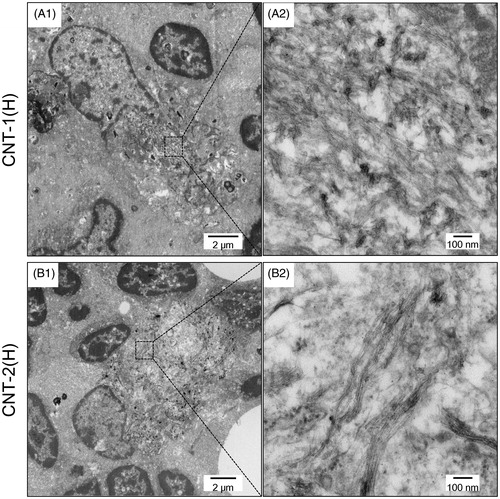
Figure 6. Changes in gene expression over time in rat lungs intratracheally instilled with CNT-1 or CNT-2 in the high-dose group. Number of significantly upregulated or downregulated genes at each time point following exposure to CNT-1 or CNT-2 (A). Changes in p values over time for the statistically overrepresented GO terms “inflammatory response” (GO: 0006954), “cell proliferation” (GO: 0008283), and “immune system process” (GO: 0002376) among CNT-1 and CNT-2-induced genes (FC > 1 or FC < −1) with p < 0.05 (B). Number of selectively upregulated genes involved in inflammatory responses at 1, 3, and 90 d post-instillation with CNT-1 or CNT-2 (C). Number of upregulated or downregulated genes with p < 0.05 at each time point.
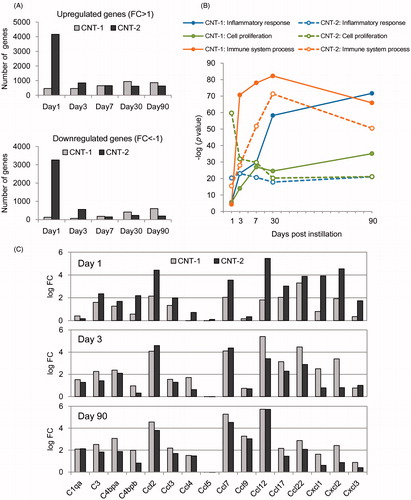
Figure 7. Effects of CNT-1 or CNT-2 on cell viability, intracellular ROS levels, and MIP-1α expression in NR8383 cells. Cell viability was measured using the WST-1 assay after exposure to CNT-1 or CNT-2 for 6 or 24 h. The viability of CNT-1- and CNT-2-treated cells in the WST-1 assay is expressed as the percentage of live cells remaining compared to that observed for untreated control cells (A). Intracellular ROS levels were measured in DCFH-DA assays with a flow cytometer following exposure to CNT-1 or CNT-2 for 6 or 24 h. DCFH-DA fluorescence in treated cells was expressed as the ratio to that observed in untreated control cells, which was set to 100% (B). The levels of MIP-1α in NR8383 cells exposed to CNT-1 or CNT-2 for 6 h or 24 h were measured. Values are the mean ± SD of four independent experiments. **p < 0.01, *p < 0.05 (versus control cells at each time point, Dunnett, ANOVA; C).
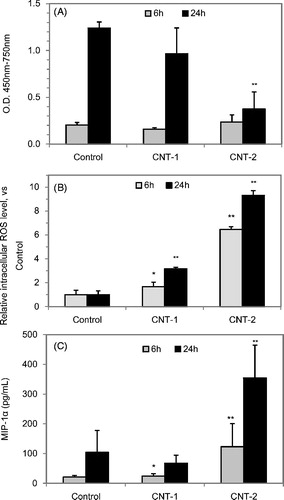
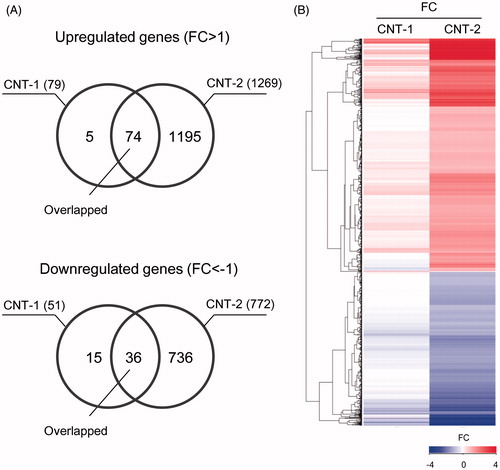
Figure 8. TEM images of NR8383 cells exposed to CNT-1 (A and B) or CNT-2 (C and D) for 24 h. Images in A and C are shown enlarged in B and D, respectively.
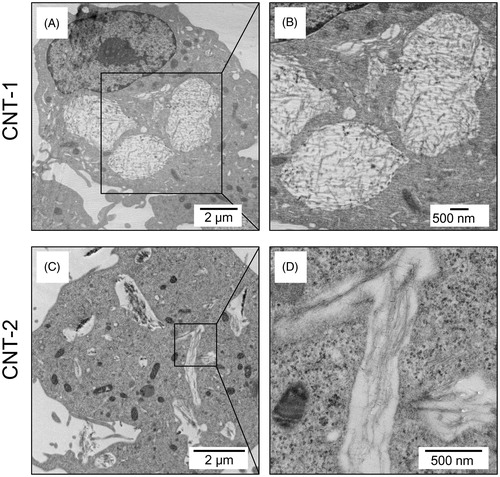
Figure 9. Effects of CNT-1 and CNT-2 on gene expression in NR8383 cells. Venn diagram showing the number of upregulated and downregulated genes in NR8383 cells exposed to CNT-1 or CNT-2 for 24 h (A). Heat map generated from DNA microarray data reflecting differential expression of genes involved in the response to stimulus (GO: 0050896) in NR8383 cells exposed to CNT-1 or CNT-2 for 24 h. Expression levels are colored blue for low intensity and red for high intensity (see scale at the bottom right corner) (B).