
Figures & data
Figure 1. Best-fit equation relating the prevalence of pleural plaques, TSFE and mean exposure (f/ml) as determined by Paris et al. (Citation2008).
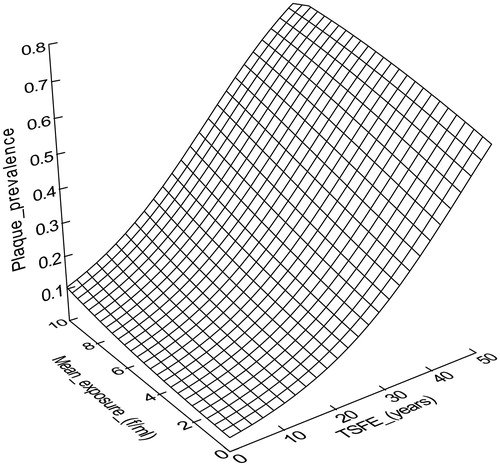
Figure 2. Contour lines of the best fit model shown in .
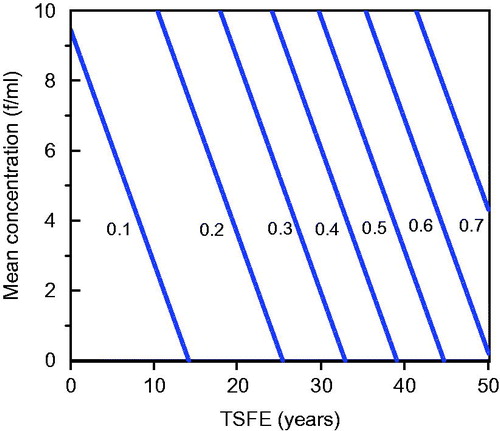
Figure 1. Best-fit equation relating the prevalence of pleural plaques, TSFE and mean exposure (f/ml) as determined by Paris et al. (Citation2008).
Figure 2. Contour lines of the best fit model shown in .