Figures & data
Figure 1. Diagram of a prototype e-cigaret showing the airflow pathway beginning on the left (arrows) and airflow past the battery and heated coil, where the aerosol mass is generated and drawn out through the mouthpiece (far right).
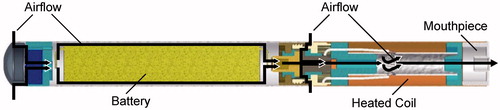
Table 1. Study design, treatment groups and exposure group assignments for male and female Sprague–Dawley rats exposed to prototype e-cigaret aerosol formulations.
Table 2. Summary of biological parameters under evaluation for 28, 90 and 132 days to vehicle, Formulation 1 and Formulation 2.
Table 3. Cumulative aerosol mass target and actual aerosol concentrations for exposure groups 1–10 during 90-day inhalation exposure to aerosol formulations.
Table 4. Cumulative mass median aerodynamic diameter (MMAD) and geometric standard deviation (GSD) for exposure groups 1–10 during 90-day inhalation exposure to aerosol formulations.
Figure 2. Male (A) and female (B) body weights during 13-weeks exposure to vehicle control, Formulation 1 and Formulation 2 by inhalation followed by a 42-day recovery period.
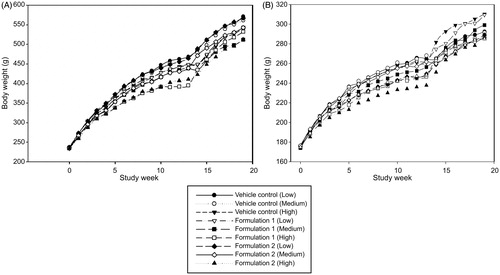
Table 5. Plasma nicotine and cotinine levels in male and female rats at day 28 and day 90.
Table 6. Analysis of BALF from male and female rats exposed to various dose levels of vehicle, Formulation 1, Formulation 2 or Reference product by inhalation for 28 days.
Table 7. Analysis of BALF from male and female rats exposed to various dose levels of vehicle, Formulation 1, Formulation 2 or Reference product by inhalation for 90 days.
Table 8. Analysis of bronchoalveolar lavage fluid from male and female rats exposed to various dose levels of vehicle, Formulation 1, Formulation 2 or Reference product by inhalation for 90 days followed by a 42-day recovery period.
Table 9. Histopathology incidence findings in male and female rats exposed to various dose levels of vehicle, Formulation 1, Formulation 2 or Reference product by inhalation for 28 days.
Figure 3. Photomicrograph of section through nose of male rat at nasal section 1 depicting mucus cell hyperplasia of the epithelium after 90-days inhalation exposure to high dose of Formulation 2 (20 × magnification).
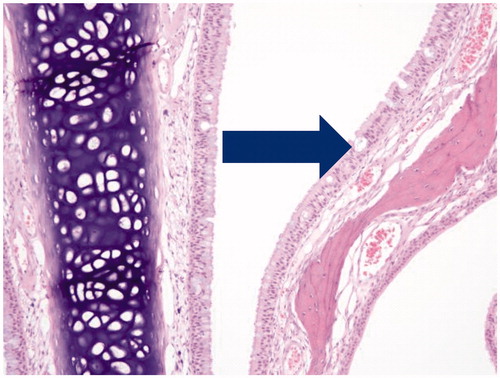
Figure 4. Photomicrographs of pulmonary alveolar macrophages (“foam cells”) in the lung of male rats after 90-days of inhalation exposure to high dose of (A) vehicle control or (B) Formulation 2 (20 × magnification).
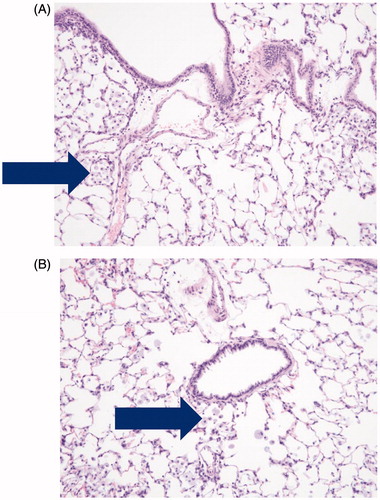
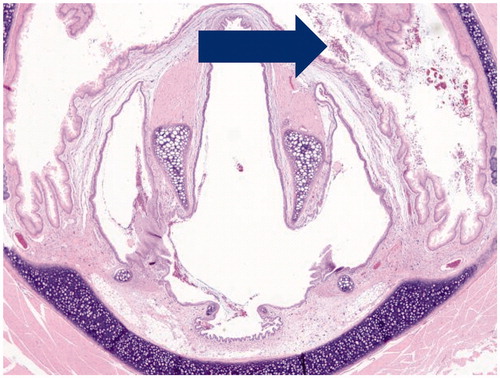
Figure 5. Cross-section through the larynx of a male rat exposed to high dose of Formulation 2, (4 × magnification depicting luminal exudate, primarilly mucin).