Figures & data
Table 1. Comparison of OECD 413 histopathological levels analyzed by the tobacco industry and the current study.
Table 2. Body weight and body weight gain on the day of sacrifice following sham air or 3R4F reference cigarette exposure for 3 or 6 weeks.
Figure 1. The histopathological response of nasal cavity endpoints following sham air or 3- and 6-week 3R4F CS exposure. Values plotted are mean severity score ± SEM of reserve (basal) cell hyperplasia (respiratory epithelium), squamous epithelial metaplasia (respiratory epithelium), loss of goblet cells (septum) and atrophy (olfactory epithelium). Statistical significance when compared to sham air (*), 1-h 3R4F exposure (+) or 3-week exposure time point (#) are detailed.
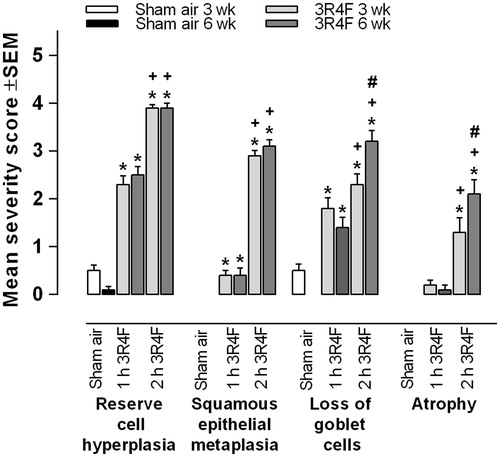
Figure 2. Histopathological responses following 6-week sham air or 3R4F CS exposure (2 h/day). (A–F): 25× magnification, (A′–F′): 200× magnification of sham air exposure group. (A″–F″): 200× magnification of 3R4F CS exposure for 2 h/day. (A″): Atrophy of the nasal olfactory epithelium at dorsal meatus associated with loss of nerve bundles in the lamina propria. (B″): Respiratory epithelium nasal reserve (basal) cell hyperplasia and initial squamous epithelial metaplasia. (C″): Larynx epithelial hyperplasia and cornification at the lower medial region of vocal cords (arytenoid projections). (D″): Reserve (basal) cell hyperplasia of the tracheal epithelium. (E″): Left lung (parenchyma) yellow pigmented and non-pigmented macrophages in the alveolar lumen. (F″): Left lung (main bronchus) bronchial epithelium goblet cell hyperplasia.
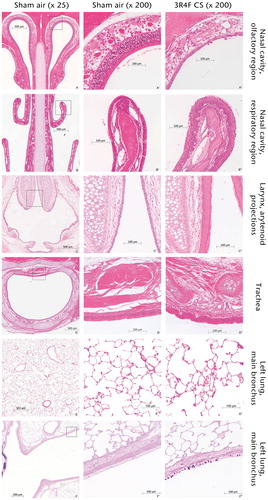
Table 3. Histopathological analysis of the nasal cavity following sham air or 3R4F CS exposure for 3 and 6 weeks.
Figure 3. The histopathological response of the larynx following 3- and 6-week sham air or 3R4F CS exposure. Values plotted are mean severity score ± SEM of squamous epithelial metaplasia and cornification (base of epiglottis), epithelial hyperplasia and cornification of lower medial region (LMR) of vocal cords (arytenoid projections). Statistical significance when compared to sham air (*), 1-h 3R4F exposure (+) or 3-week exposure time point (#) are detailed.
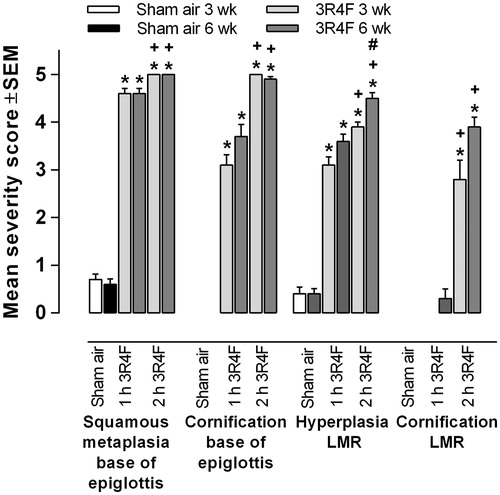
Figure 4. Morphometrical evaluation of the larynx following 3- and 6-week sham air or 3R4F CS exposure. Values are mean severity score ± SEM of mean thickness of epithelium and floor of the larynx, lower medial region (LMR) of vocal cords (arytenoid projections). Statistical significance when compared to sham air (*), 1-h 3R4F exposure (+) or 3-week exposure time point (#) are detailed.
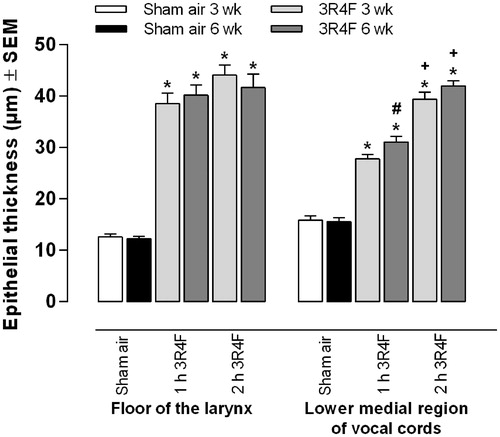
Table 4. Histopathological analysis of the larynx following sham air or 3R4F CS exposure for 3 and 6 weeks.
Figure 5. The histopathological response of the trachea and lung following 3- and 6-week sham air or 3R4F CS exposure. Values plotted are mean severity score ± SEM of the trachea (reserve cell hyperplasia) and left lung lobe (non-pigmented macrophages, yellow pigmented macrophages, bronchial goblet cell hyperplasia). Statistical significance when compared to sham air (*), 1-h 3R4F exposure (+) or 3-week exposure time point (#) are detailed.
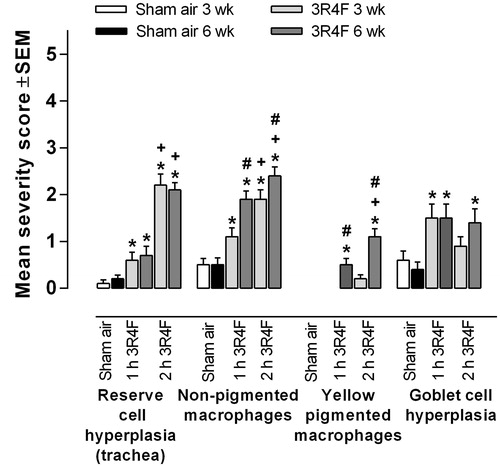
Table 5. Histopathological analysis of the trachea and left lung following sham air or 3R4F CS exposure for 3 and 6 weeks.
Figure 6. The level of DNA damage as measure by the (A) Alkaline Comet assay (single strand breaks) and (B) Modified Alkaline Comet assay (oxidative DNA damage) in isolated AEC II after 3 and 6 weeks exposure to sham air or 3R4F CS for 1 or 2 h/day. Values plotted are mean % DNA tail ± SD. Statistical significance when compared to sham air (*) or 3-week exposure time point (#) are detailed.
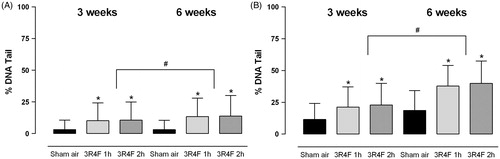
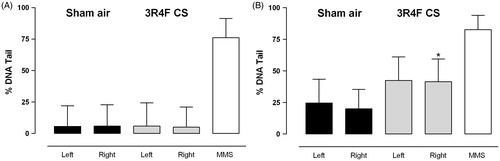
Figure 7. The level of basal DNA damage and MMS induced DNA damage as measured by the Alkaline Comet assay in isolated AEC II from the left and right lung lobes. Values plotted are mean % DNA tail ± SD.
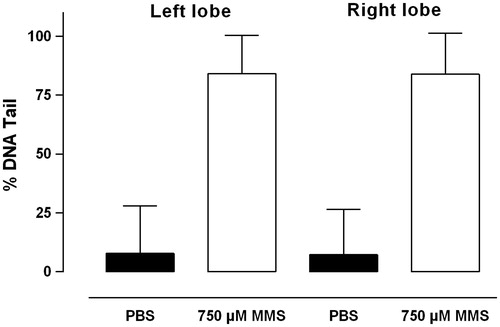
Figure 8. The level of DNA damage as measure by the (A) Alkaline Comet assay (single strand breaks) and (B) Modified Alkaline Comet assay (oxidative DNA damage) in isolated AEC II following 5 days exposure to sham air or 3R4F CS for 1 h/day. Values plotted are mean % DNA tail ± SD. *Statistical significance when compared to sham air exposed corresponding lung lobe.