Figures & data
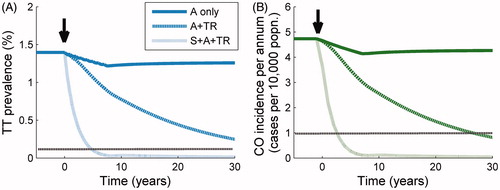
FIGURE 1. Trachoma disease model diagram. Compartmental disease model based on the ladder of infection framework of Gambhir and colleaguesCitation7 with an extension to take into account development of corneal opacities (CO) from the population of those who previously developed trachomatous scarring (TS) and then trichiasis (TT). The disease states TS and TT are developed through repeat infection, but development of CO is not linked to further infection and occurs at a constant rate as a consequence of mechanical corneal damage incurred by those with TT (see Supplemental Appendix for model parameters).
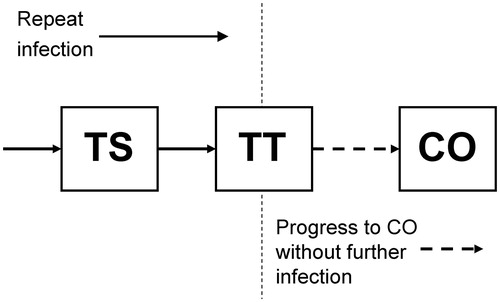
TABLE 1. Trachoma treatment schedules implemented at three individual control interventions and three intensity levels. Each set of three simulated annual MDA rounds, for medium and high intensities of the antibiotic intervention, are conducted immediately following the previous three annual rounds.
TABLE 2. Global Elimination of blinding Trachoma by 2020 (GET2020) program goals and the implementation of components of the full intervention strategy individually and in concert. Each component of the full intervention strategy is implemented at a low, medium or high intensity, corresponding to the schedules detailed in . Outcome measures are stated here such that a value of 1.0 represents achievement of the GET2020 goals. The dark-shaded cells are those in which the GET2020 goals have been achieved and cells that are light-shaded correspond to schedules in which the goal is almost achieved (i.e. within 100% of the goal).
FIGURE 2. Response of trachoma disease sequelae prevalence to treatment. Simulated age-dependent prevalence of disease sequelae (trachomatous scarring [TS], dark blue lines [left]; trachomatous trichiasis [TT], light blue lines [middle]; and corneal opacities [CO], green lines [right]), in a high-endemicity trachoma setting at baseline, following three treatment schedules; (A) antibiotics (A) only, at high intensity; (B) A+ transmission reduction (TR) both at high intensity; (C) surgery (S) + A + TR all at high intensity. In each plot, the thicker lines represent baseline prevalence over age and each subsequent lower curve is plotted at 5-year intervals such that the bottom-most curves represent the prevalence levels 20 years after baseline. In (A), the markers indicate the prevalence values of TS, TT, and CO observed in Kongwa, TanzaniaCitation9 with error bars representing 95% confidence intervals of the collected dataset.
![FIGURE 2. Response of trachoma disease sequelae prevalence to treatment. Simulated age-dependent prevalence of disease sequelae (trachomatous scarring [TS], dark blue lines [left]; trachomatous trichiasis [TT], light blue lines [middle]; and corneal opacities [CO], green lines [right]), in a high-endemicity trachoma setting at baseline, following three treatment schedules; (A) antibiotics (A) only, at high intensity; (B) A+ transmission reduction (TR) both at high intensity; (C) surgery (S) + A + TR all at high intensity. In each plot, the thicker lines represent baseline prevalence over age and each subsequent lower curve is plotted at 5-year intervals such that the bottom-most curves represent the prevalence levels 20 years after baseline. In (A), the markers indicate the prevalence values of TS, TT, and CO observed in Kongwa, TanzaniaCitation9 with error bars representing 95% confidence intervals of the collected dataset.](/cms/asset/13bff604-a0fc-49f5-95db-2a529241ba4b/iope_a_1081249_f0002_c.jpg)
FIGURE 3. Response of trachomatous trichiasis (TT) prevalence and corneal opacity (CO) incidence to treatment. Trend in: (A) prevalence of TT, and (B) incidence of CO through time following three treatment schedules initiated at 0 years (black arrow). From the uppermost to the bottom curve, the population is subjected to mass drug administration (MDA) at high intensity (dark solid line), MDA + transmission reduction (TR) both at high intensity (upper dark dotted line), and MDA + TR + surgery (S), all at high intensity (lower light dotted line). The horizontal dotted line represents the relevant threshold for the Global Elimination of blinding Trachoma by 2020 (GET2020) program goals (a level of one case of CO per 10,000 persons per annum, and a prevalence of one case of TT per 1000 persons).