Figures & data
Figure 1. PM quantifies platelet adhesion under flow conditions. (A) Whole blood was perfused at 1000 s−1 over type I collagen fibers (○) or VWF-III (•) and images were acquired at 0.2 Hz for 5 min. Image processing yielded PM measurements throughout the 5-min perfusion, which are plotted vs. time. PM curves were modeled as exponential decays, yielding the parameter of Plateau (B) (see Supplementary material for details). End-point image analysis yielded ZV50 (C).
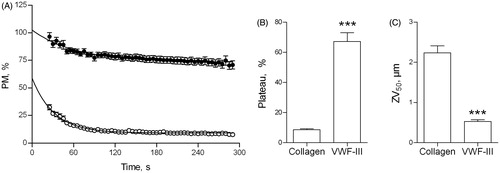
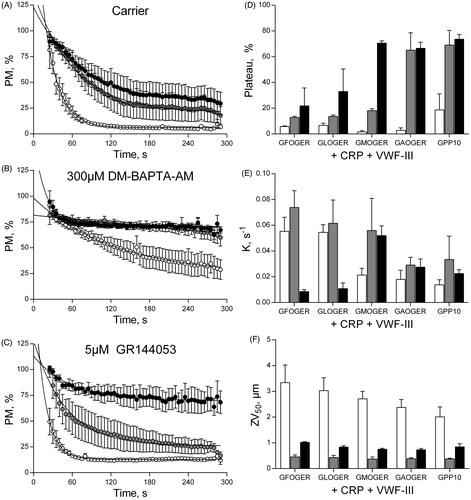
Figure 2. PM quantifies integrin activation under flow conditions. Whole blood was pre-treated with carrier (A), 300 µM DM-BAPTA-AM (B) or 5 µM GR144053 (C), before perfusion at 1000 s−1 over coverslips coated with combinations of CRP, VWF-III and one of a panel of integrin α2β1-adhesive peptides of varying affinities. PM was calculated as before. For clarity, only GFOGER, (○), GMOGER (•) and GPP10 (•) are shown. Other data sets (GLOGER and GAOGER) are shown in Supplementary Figure S2. End-point measurements were calculated as described in the text, Plateau (D), Decay constant (E) and ZV50 (F). Blood was pre-treated with: Carrier (□), 5 µM GR144053 (▪), 300 µM DM-BAPTA-AM (▪).