
Figures & data
Table I. Demographic and treatment duration information by exposure group.
Figure 1. Kaplan–Meier curves of the proportion of patients not failing treatment over time for patients initially prescribed one combination product (solid line), one monotherapy product (long-dashed line), or two or more monotherapy products (dotted line).
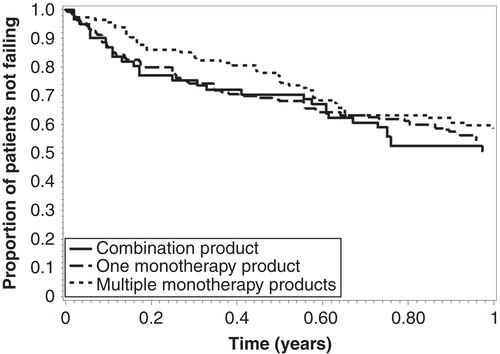
Table II. Cox proportional hazards estimates for hazards of changing acne treatment.