Figures & data
Table I. Nucleotide sequence of investigated TFO and corresponding target sequence. Asterisks (*) indicate that no triplex formation could be detected for these TFO by EMSA.
Figure 1. Sequences of used I-125-TFO. Labeling of TFO with I-125 was done by the primer extension method. Sequences of TFO and templates are written in plain text, I-125-cytosines added by Klenow polymerase are shown bold and underlined. Templates were modified with biotin (Bio) at the 3′-end.
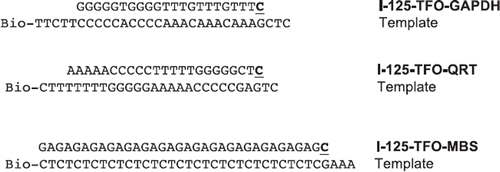
Figure 2. Triplex formation in vitro visualized with electrophoretic mobility shift assay. Negative controls containing the specific TFO target fragment only, -; Triplex-forming oligonucleotides with their specific target sequences, TFO-V(x); Non-sense samples containing the target sequence with a non-complementary TFO, o; A band shift reflects DNA triplex formation, ![]()
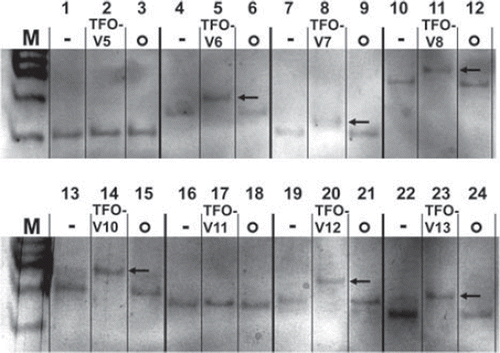
Figure 3. Schematic diagram of the 1695 bp long DNA fragment containing the target sequence for TFO-GAPDH and the two expected breakage fragments of 681 bp and 1024 bp length. The TFO is I-125-labeled at the 3′-terminal cytosine and binds to the polypurine target sequence in reverse orientation.
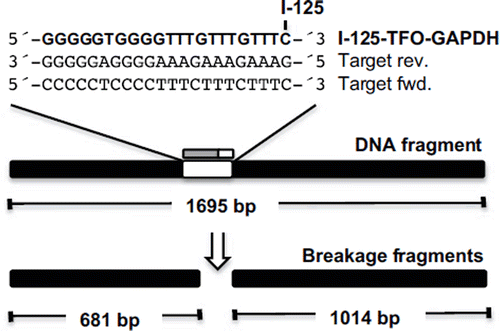
Figure 4. DSB analysis of a 1695 bp DNA fragment ![]()
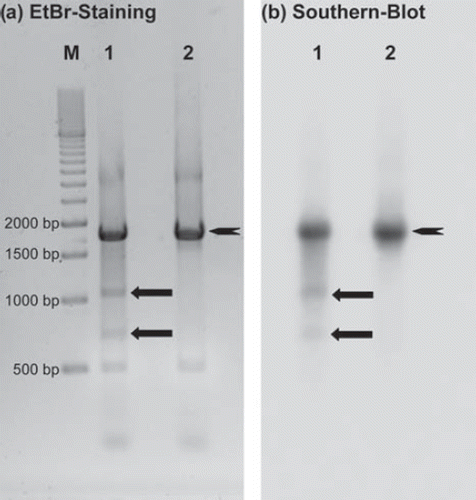
Figure 5. Cell survival curves of SCL-II cells after transfection with I-125-TFO-MBS (♦, —), I-125-TFO-QRT (■, ----) or I-125-TFO-GAPDH (Δ, -----). For decay accumulation, the transfected samples were stored at − 150°C. The data were fitted according to the exponential model of cell survival.
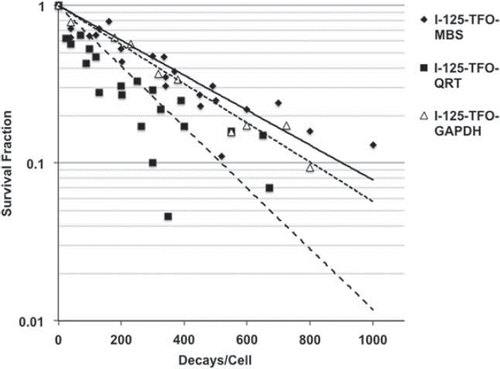
Figure 6. Double-strand break detection by the 53BP1 foci assay in SCL-II cells after transfection with I-125-TFO-MBS (♦, — ), I-125-TFO-QRS (■, -----) and I-125-TFO-GAPDH (Δ, -----). Negative controls (not displayed) were transfected with the corresponding unlabeled TFO and showed on average ∼ 0.8 foci/cell. For decay accumulation the samples were stored at − 150°C for decay accumulation. Data points were fitted according to a linear model
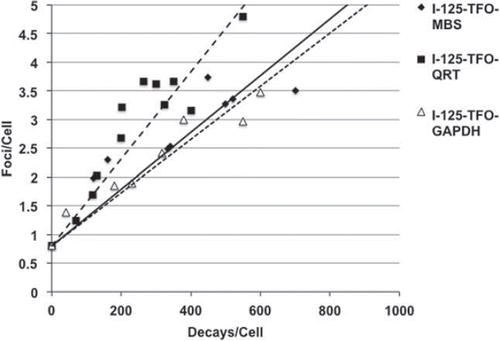
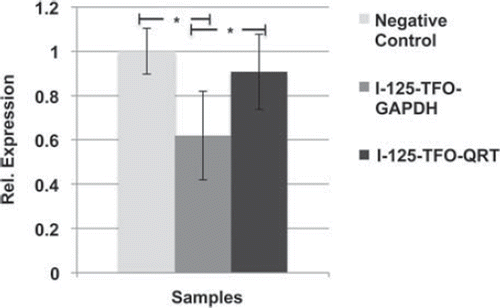
Figure 7. Relative gene expression of GAPDH after transfection with I-125-TFO-GAPDH (n = 7), I-125-TFO-QRT (n = 3) and unlabeled TFO-GAPDH (n = 3) as negative control. The (I-125-)TFO-GAPDH binds to a single target sequence in the GAPDH gene. I-125-TFO-QRT binds to multiple targets in the whole human genome. Error bars indicate the standard error of the mean (SEM) of n independent experiments. (* = p-value 0.05).