
Figures & data
Figure 1. (A) Schematic illustration of the preparation of 111In-EGF-Au NP. Au NP were synthesized via the citrate reduction method and then conjugated with chelating ligand DTPA-coupled EGF to form EGF-Au NP. After purification, the EGF-Au NP were radiolabeled with 111In to produce 111In-EGF-Au NP. (B) Detailed procedures to synthesize 111In-EGF-Au NP.
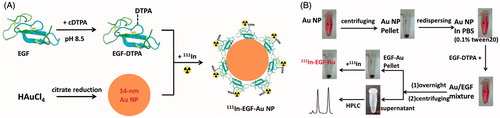
Figure 2. (A) EGF loading as a function of the molar mixing ratio of DTPA-EGF to Au NP. Results are expressed as the mean ± SD of three independent experiments. (B) G50 size-exclusion chromatography (SEC) of 111InCl3 and 111In-labeled EGF-Au NP generated using mixing ratios of 40, 80, 120 and 160, respectively, showing that EGF-Au NP for each mixing ratio were successfully radiolabeled with 111In. (C) Stability of 111InCl3 in PBS (left panel) and FBS (right panel) showing that a large portion of 111In was associated with proteins in FBS. (D) Stability of 111In-EGF-Au (EGF:Au = 160) in PBS (left panel) and FBS (right panel) performed by size exclusion HPLC with a radio detector, showing no 111In-transchelation to serum proteins.
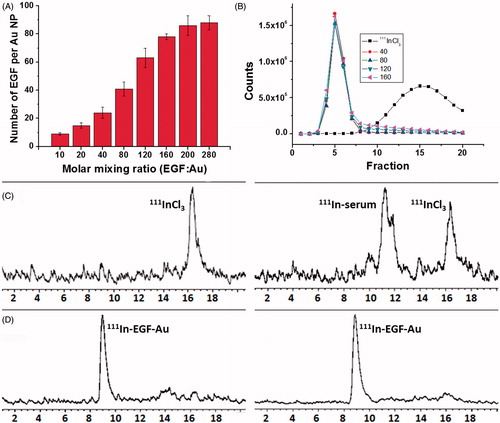
Figure 3. (A) Cellular internalization of 111In-EGF-Au NP of varying EGF/Au ratio (all containing 40 nM EGF) and 111InCl3 at 4 h. Results are expressed as the mean ± SD of three independent experiments. (B) Competitive binding assay: Increasing concentrations of unlabeled EGF were incubated with MDA-MB-468 cells and 111In-EGF-Au NP (mixing ratio: 160; containing EGF concentration of 10 nM).
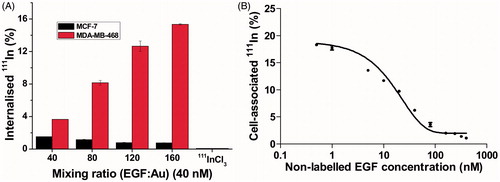
Figure 4. Representative confocal microscopy images of MDA-MB-468 (upper images) and MCF-7 (lower images) cells after incubation for 4 h with Cy3-EGF-Au NP ([EGF] = 40 nM) at 4 °C and 37 °C.
![Figure 4. Representative confocal microscopy images of MDA-MB-468 (upper images) and MCF-7 (lower images) cells after incubation for 4 h with Cy3-EGF-Au NP ([EGF] = 40 nM) at 4 °C and 37 °C.](/cms/asset/db396e05-fcae-48c9-9a2e-04e1b9c16b8d/irab_a_1145360_f0004_c.jpg)
Figure 5. (A) Clonogenic survival of MDA-MB-468 and MCF-7 cells after 4 h exposure to 111In-EGF-Au (Mixing ratios, 40–160; [EGF] = 40 nM; specific activity: 37.5 MBq/nmol) or equivalent amounts of 111InCl3 or unlabeled EGF-Au with mixing ratio of 40. Results are expressed as the mean ± SD of three independent experiments. (B) Model of an EGF-Au NP used to calculate the footprint (k) of EGF that varies depending on the number of EGF attached per Au NP.
![Figure 5. (A) Clonogenic survival of MDA-MB-468 and MCF-7 cells after 4 h exposure to 111In-EGF-Au (Mixing ratios, 40–160; [EGF] = 40 nM; specific activity: 37.5 MBq/nmol) or equivalent amounts of 111InCl3 or unlabeled EGF-Au with mixing ratio of 40. Results are expressed as the mean ± SD of three independent experiments. (B) Model of an EGF-Au NP used to calculate the footprint (k) of EGF that varies depending on the number of EGF attached per Au NP.](/cms/asset/afd3a7c9-f69e-4607-b050-7607d420696d/irab_a_1145360_f0005_c.jpg)