Figures & data
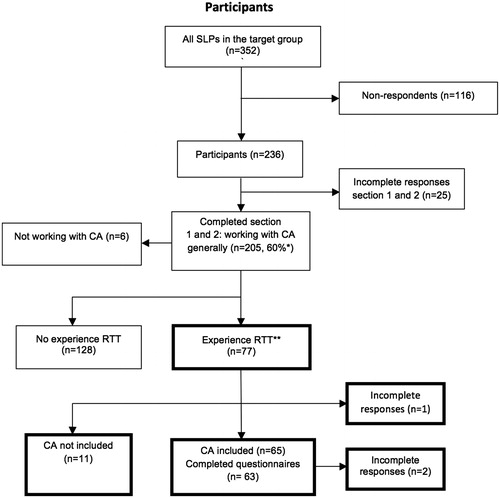
Figure 1. Flow chart over participants. SLP, speech language pathologists; RTT, Rett syndrome; CA, communication aid. *Percentage of all SLPs in the target group:SLPs working with people currently receiving support from habilitation services. **Participants in this study.