
Figures & data
Figure 1. Study design.
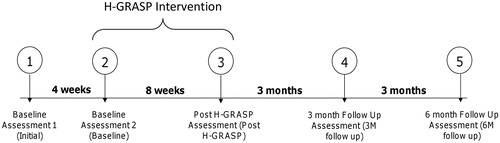
Table 1. H-GRASP behavioural-change techniques.
Table 2. Feasibility outcomes.
Figure 2: Participant flow diagram.
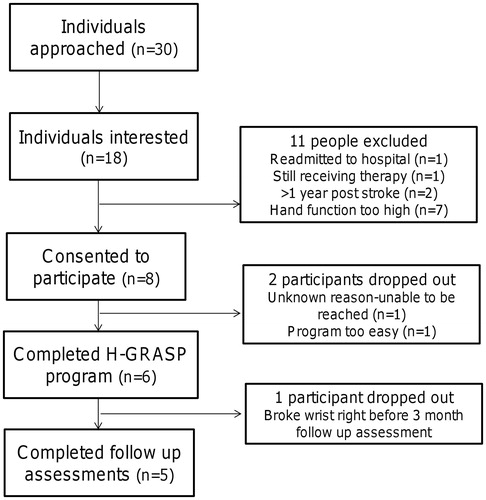
Table 3. Participant characteristics.
Table 4: Clinical outcomes and exercise minutes.
Figure 3: Participant outcome measure profiles. This graph displays clinical measure scores across the study period by participant. CAHAI: Chedoke Arm and Hand Inventory (0–63); MALQ: Motor Activity Log Quality of Movement Scale (0–5); Grip: Grip Strength; COPM: Canadian Occupational Performance Measure (1–10)
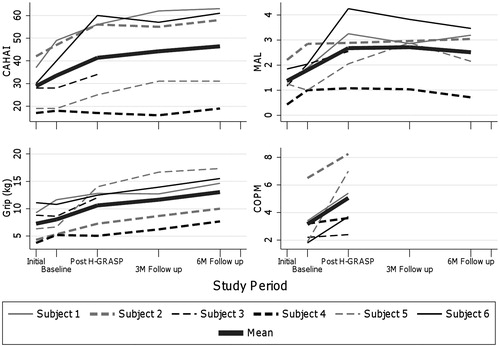
Table 5. COPM activities and scores by participant.