Figures & data
Figure 1. Effect of pCMBS on wild-type hERG channels. (A) Schematic of the topology of a single hERG subunit. Approximate location of negative charges in S1–S3 is shown in filled circles for conserved positions, and in open circles for positions unique to hERG; residues of S4 tested in this study (522–531) are shown in filled circles in S4. (B) Time course of the effect of pCMBS on wild-type hERG. Top, schematic of the repeated pulse protocol used to measure hERG currents. Cells were depolarized to +30 mV for 500 ms from −80 mV at intervals of 20 s. Peak tail currents were measured at −80 mV following each depolarizing step. Horizontal bar indicates time period over which 100 µM pCMBS was applied. Bottom graph shows representative data for wild-type hERG obtained using the pulse protocol. (C) Top, Schematic of the I-V protocol; cells were depolarized for 500 ms to voltages between −60 mV and 80 mV in 10 mV steps from a h.p. of −80 mV; steps were separated by 20 s. Bottom, normalized I-V relationships for wild-type channels calculated from peak currents recorded at −80 mV following each depolarizing step, before (○) and after (•) exposure to 100 µM pCMBS. The smooth curves correspond to data fitted to the Boltzmann function; n = 3. Inset shows current traces recorded at −80 mV following an 80 mV step, before (black trace) and after (grey trace) after exposure to 100 µM pCMBS.
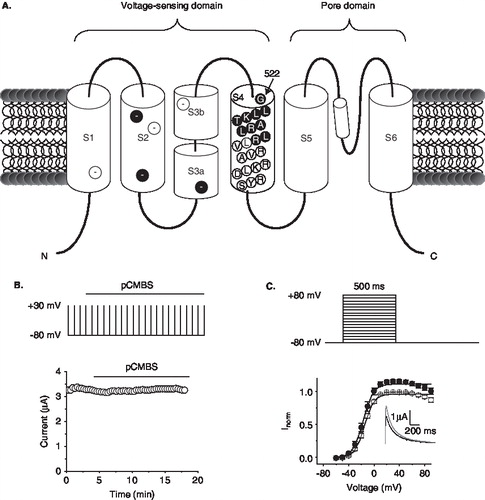
Figure 2. Accessibility of substituted S4 cysteines to extracellular pCMBS. Effect of pCMBS on the I-V relationships of indicated S4 hERG cysteine mutant channels measured as described in the legend to . Inset shows current traces recorded at −80 mV following an 80 mV step, before (black trace) and after (grey trace) after exposure to 100 µM pCMBS. pCMBS inhibited currents through G522C to L529C channels significantly (p < 0.05), but has no effect on L530C and R531C (p ≥ 0.05).
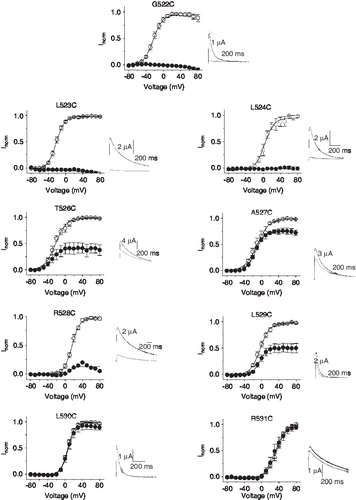
Figure 3. State-dependent accessibility of S4 cysteines to extracellular pCMBS. (A) Sequence alignment of the S4 region of the Shaker (GI: 24642914) and hERG (GI: 4557729) potassium channels. (B) Time course of the effect of pCMBS on currents through the indicated hERG S4 cysteine mutant channels, measured as described in the legend to Figure 1B. (C) State-dependence of pCMBS effect. Top, protocol used to determine the state-dependence: Current recordings were made as in Figure 1B except that after recording control currents, cells where held at −80 mV with no depolarizing steps for 10 min (to keep the channels in the closed state; see Methods), before resuming depolarizing pulses. pCMBS application began whilst cells were at held at −80 mV as indicated by the horizontal bar. pCMBS reacted G522C, L523C, but not L524 at −80 mV, as indicated by a change in current amplitude measured immediately after the −80 mV holding step (gap in data points).
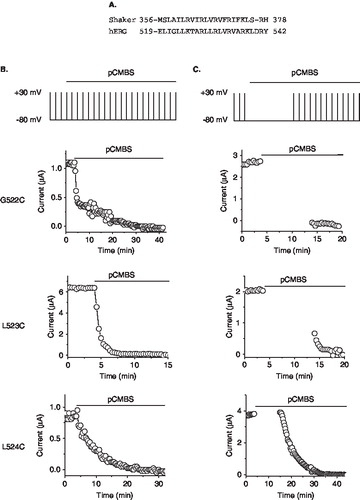
Figure 4. Model of the voltage sensing paddle of hERG showing changes in accessibility to extracellular solvent during depolarization. (A) Sequence alignment of the voltage sensing paddles of the KvAP (GI: 14601099), hERG (GI: 4557729), Shaker (GI: 24642914) and bEAG (GI: 31342184) potassium channels. S3b and S4 regions are indicated by the top horizontal lines. Key voltage sensing positively charged residues are shown in bold (numbered 1–4). Residues shaded in grey are exposed to extracellular solvent in studies on Shaker [Citation17,Citation27], KvAP [Citation19,Citation26] and hERG (this study) and bEAG [Citation29]; arrow indicates the membrane-aqueous border based on the experimental data for KvAP, Shaker and hERG. (B) Structural model of the hERG paddle highlighting the residues (side chains of residues shaded grey in [A] are shown; positive charges labelled) whose position changes from being within the membrane (resting) to extracellular solvent when the channel is activated/inactivated; the dotted line denotes the putative outer membraneaqueous border for S4. The model, based on the coordinates of KvAP (PDB code: 1ORQ), is taken from the SWISS MODEL Repository [Citation32]. The paddle is orientated using the position of the S3b–S4 paddle in the Kv1.2 crystal structure (PDB code: 2A79) as a guide. It should be noted that the cartoon was not meant to indicate the type of physical motion the paddle undergoes.
![Figure 4. Model of the voltage sensing paddle of hERG showing changes in accessibility to extracellular solvent during depolarization. (A) Sequence alignment of the voltage sensing paddles of the KvAP (GI: 14601099), hERG (GI: 4557729), Shaker (GI: 24642914) and bEAG (GI: 31342184) potassium channels. S3b and S4 regions are indicated by the top horizontal lines. Key voltage sensing positively charged residues are shown in bold (numbered 1–4). Residues shaded in grey are exposed to extracellular solvent in studies on Shaker [Citation17,Citation27], KvAP [Citation19,Citation26] and hERG (this study) and bEAG [Citation29]; arrow indicates the membrane-aqueous border based on the experimental data for KvAP, Shaker and hERG. (B) Structural model of the hERG paddle highlighting the residues (side chains of residues shaded grey in [A] are shown; positive charges labelled) whose position changes from being within the membrane (resting) to extracellular solvent when the channel is activated/inactivated; the dotted line denotes the putative outer membraneaqueous border for S4. The model, based on the coordinates of KvAP (PDB code: 1ORQ), is taken from the SWISS MODEL Repository [Citation32]. The paddle is orientated using the position of the S3b–S4 paddle in the Kv1.2 crystal structure (PDB code: 2A79) as a guide. It should be noted that the cartoon was not meant to indicate the type of physical motion the paddle undergoes.](/cms/asset/3606317c-ab34-41c0-8881-a9dfc6f5d6d5/imbc_a_432282_f0004_b.jpg)