Figures & data
Figure 1. (A) Western blot analysis of wild-type and mutant kAE1 proteins, tagged with 6xHis or Myc or HA, expressed in HEK 293T cells, (B) affinity co-purification, and (C) co-immunoprecipitation of wild-type and mutant kAE1 proteins in HEK 293T cells. HEK 293T cells transfected or co-transfected with the plasmid constructs expressing kAE1-His and kAE1-HA were lysed and 6xHis-tagged oligomers were purified by Co2+ resin or immunoprecipitated (IP) by mouse anti-His antibody followed by Protein G-sepharose. The bound protein was eluted by 2× Laemmli buffer and detected by Western blot analysis using rabbit anti-HA antibody. Lanes 1–2 are individually expressed kAE1 WT-HA and kAE1 WT-His, respectively. Lanes 3–5 are kAE1 WT-His co-expressed with kAE1 WT-HA, kAE1 G701D-HA, and kAE1 A858D-HA, respectively. Lane 6 is kAE1 G701D-His co-expressed with kAE1 A858D-HA. Lane 7 is kE1 A858D-His co-expressed with kAE1 G701D-HA. The results show that kAE1 WT-His could interact with either kAE1 WT-HA, kAE1 G701D-HA, or kAE1 A858D-HA. In addition, kAE1 G701D-His could interact with kAE1 A858D-HA, and kAE1 A858D-His could interact with kAE1 G701D-HA.
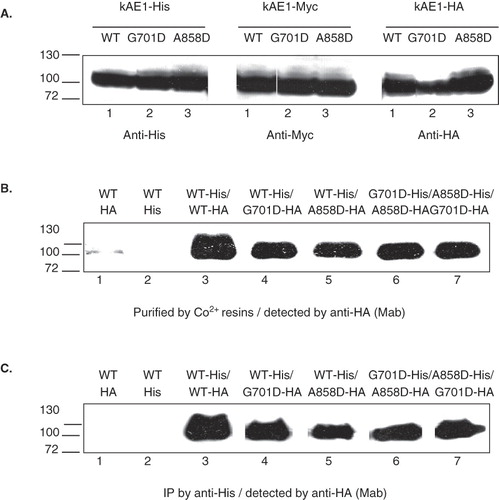
Figure 2. (A) Immunofluorescence staining of kAE1 WT, kAE1 G701D, and kAE1 A858D, tagged with Myc or HA, expressed in HEK 293T cells, (B) immunofluorescence staining of kAE1 WT-Myc co-expressed with either kAE1 WT-HA, kAE1 G701D-HA, or kAE1 A858D-HA, and (C) immunofluorescence staining of kAE1 G701D-Myc co-expressed with kAE1 A858D-HA, and kAE1 A858D-Myc co-expressed with kAE1 G701D-HA in HEK 293T cells. Transiently transfected or co-transfected HEK 293T cells expressing kAE1-Myc or kAE1-HA were fixed and permeabilized and then stained with anti-Myc or anti-HA antibody followed by anti-mouse IgG-Alexa 488 antibodies (green) or anti-rabbit IgG-Cy3 (red). Yellow color indicates co-localized proteins. Immunofluorescence images were captured by using Zeiss LSM510 META confocal microscopy. (This figure is reproduced in colour in Molecular Membrane Biology online.)
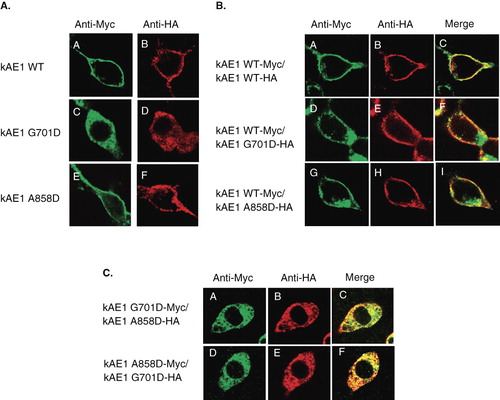
Figure 3. Cell-surface expression of Myc557-tagged kAE1 in transfected HEK 293T cells measured by flow cytometry. The transfected cells were incubated with mouse anti-Myc antibody followed by anti-mouse immunoglobulin G antibody conjugated with Alexa 488. Fluorescence intensity was detected by flow cytometry with kAE1-positive cells showing heterogeneous expression above background levels. (A) HEK 293T expressing cells kAE1 WT-Myc (green), kAE1 G701D-Myc (pink), and kAE1 A858D-Myc (blue). (B) HEK 293T cells expressing kAE1 WT-Myc and kAE1 WT-HA (orange), kAE1 WT-Myc and kAE1 G701D-HA (blue), kAE1 WT-Myc and kAE1 A858D-HA (red), kAE1 G701D-HA and kAE1 A858D-HA (purple), and kAE1 A858D-Myc and kAE1 G701D-HA (greenish blue). The experiments were conducted in triplicates and percentages of cell-surface expression of Myc557-tagged kAE1 (mean ± SD) were shown. (This figure is reproduced in colour in Molecular Membrane Biology online.)
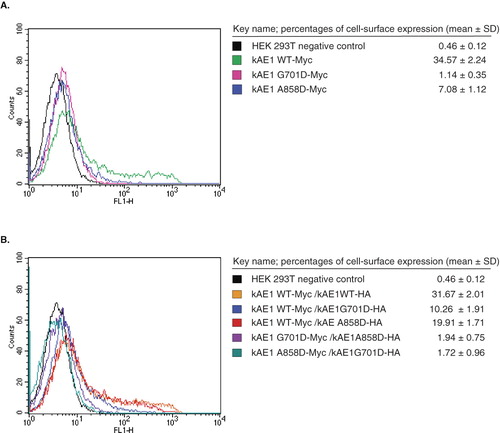
Figure 4. Western blot analysis of total cell extracts of HA557- or Myc557-kAE1 WT, G701D, and A858D (A), and co-immunoprecipitation studies (B and C). MDCK cells were infected or co-infected for 12 days and lysed by 1% C12E8 buffer. The cell extracts were loaded onto 8% SDS-PAGE and transferred to nitrocellulose membrane. For co-immunoprecipitation, the cell extract was incubated with mouse anti-HA or rabbit anti-Myc antibodies followed by Protein G-Sepharose. The bound proteins were eluted with 2× Laemmli buffer and detected by Western blot. (A) The total expressed kAE1 protein was detected by mouse anti-HA followed by anti-mouse IgG-HRP antibodies. (B) The total expressed kAE1 protein was detected by rabbit anti-kNt-AE1 antibody. (C) HA557-kAE1 WT (lane 1), G701D (lane 2) and A858D (lane 3) were co-immunoprecipitated (Co-IP) by mouse anti-HA antibody and detected by rabbit anti-kNt-AE1 antibody followed anti-rabbit IgG-HRP conjugated antibody. (D) Co-IP of Myc557-kAE1 WT with kAE1 G701D-HA (lane 4), Myc557-kAE1 WT with kAE1 A858D-HA (lane 5), kAE1 A858D-Myc with kAE1 G701D-HA (lane 6), kAE1 G701D-HA with kAE1 A858D-Myc (lane 7). The samples of lanes 4–6 were co-immunoprecipitated by rabbit anti-Myc, detected by mouse anti-HA and followed by anti mouse IgG-HRP antibody. The sample of lane 7 was co-immunoprecipitated by mouse anti-HA, detected by rabbit anti-myc, and followed by anti rabbit IgG-HRP antibody.
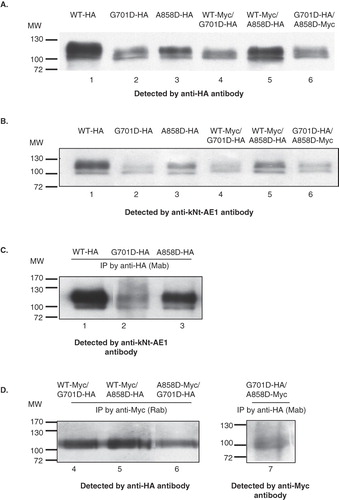
Figure 5. (A) Immunofluorescence staining of kAE1 WT-HA557, kAE1 G701D-HA557 and kAE1 A858D-HA557, and (B) co-immunofluorescence staining of kAE1 WT-Myc557 and kAE1 G701D-HA557, (C) kAE1 WT-Myc557 and kAE1 A858D-HA557, and (D) kAE1 G701D-HA557 and kAE1 A858D-Myc557 in MDCK cells. MDCK cells were fixed, permeabilized and incubated with mouse anti-HA followed by anti-mouse IgG-Alexa488 antibodies (green) or rabbit anti-myc and mouse anti-HA followed by anti-rabbit IgG-cy3 (red). Yellow color indicated co-localization of the proteins. The images were observed by Zeiss LSM510 confocal microscope. Bar represents 10 μm. X–Y shows the top view of middle section and X–Z shows the side view of the polarized cells. (This figure is reproduced in colour in Molecular Membrane Biology online.)
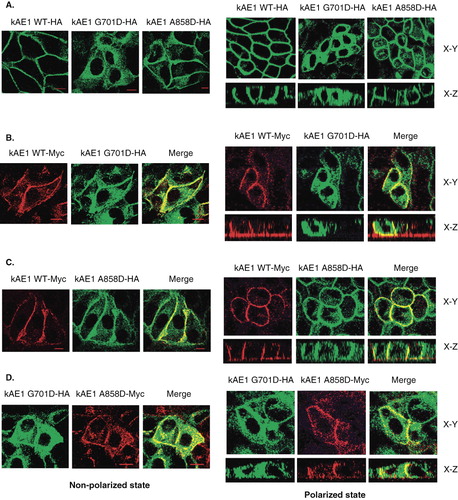
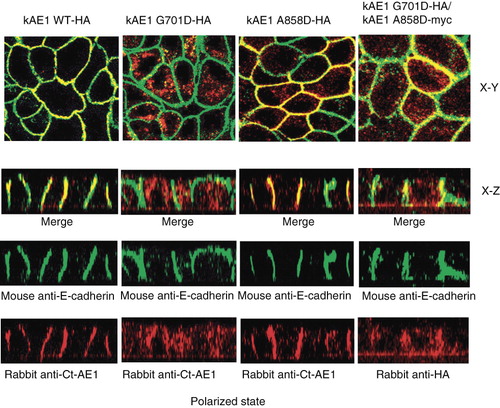
Figure 6. Co-immunofluorescence staining of individually expressed kAE1 WT-HA557, kAE1 G701D-HA557, or kAE1 A858D-HA557, and co-expressed kAE1 G701D-HA557 and kAE1 A858D-Myc557 in MDCK cells. Viral infected MDCK cells were grown on semipermeabilized filter (polarized state) for 6 days until polarized. Then cells were fixed, permeabilized and incubated with mouse anti-E-cadherin (epithelia basolateral marker) followed by anti mouse-Alexa488 (green), rabbit anti-Ct of AE1, or rabbit anti-HA (for co-expression only to detect kAE1 G701D) followed by anti rabbit IgG-Cy3 (red) antibodies. Yellow color indicates co-localization of the kAE1 proteins with E-cadherin at the basolateral membrane. The cells were observed by using the Zeiss LSM510 confocal microscope. X–Y shows the top view of the middle section and X–Z shows the side view of the polarized cells. (This figure is reproduced in colour in Molecular Membrane Biology online.)