Figures & data
Figure 1. DHHC20 and DHHS20 mRNA expression in stable NIH/3t3 clones. (A) mRNA from stably transfected 3t3 clones was isolated, reverse transcribed and amplified using primers specific for human DHHC20/DHHS20 and mouse 18s RNA as a loading control. The products were run on a 1% agarose gel and visualized by staining with ethidium bromide. (B) mRNA from stably transfected 3t3 clones was isolated, reverse transcribed, and amplified using primers specific for human DHHC20/DHHS20 and mouse 18s RNA. Amplification and quantification of the products by qPCR was carried out using the MyiQ Single Color Real-Time PCR Detection System.
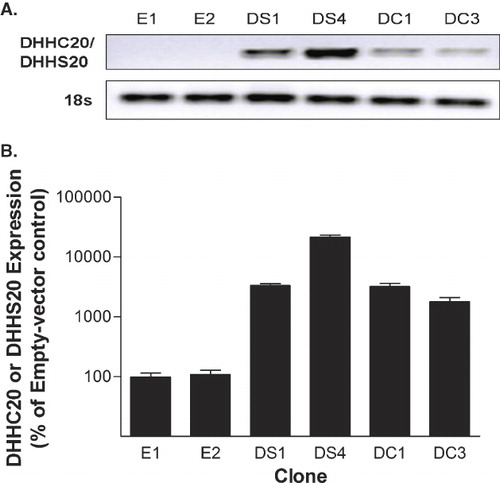
Figure 2. Enzymatic palmitoylation activity of DHHC20. In vitro palmitoylation assays were performed using membrane fractions from each of the indicated clones. The assays consisted of either 10 µM of the NBD-CLC(OMe)-Farn or MyrGC-(NBD) peptides with 100 µM palmitoyl-CoA, 15 µg membrane protein, and acylation buffer in a total volume of 50 µl. The peptide substrates were preincubated with membrane fractions derived from the indicated cell lines in acylation buffer for 8 min at 37°C with agitation. To start the reaction, palmitoyl-CoA was added, gently vortexed, and the mixture was incubated for a further 15 min at 37°C with agitation. Palmitoylated peptides were resolved by HPLC using a reverse phase wide pore butyl column and the amount of the peptide palmitoylated in each reaction was calculated based on the ratio of the palmitoylated to the total native peptide in each reaction. Statistical analyses were performed using ANOVA and the data shown represents the mean of four experiments ± SEM. (α*) indicates p ≤ 0.05 when compared to clone E1, (β**) indicates p ≤ 0.01 when compared to clones E2, DS1 and DS4.
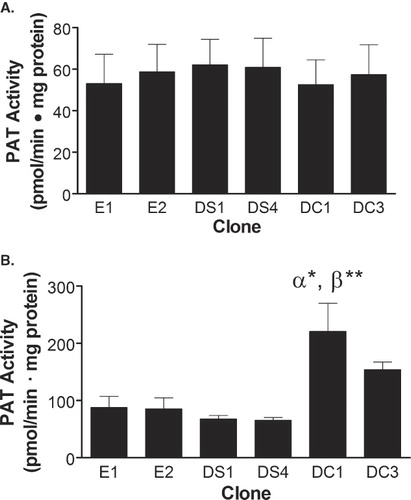
Figure 3. DHHC20 expression induces transformation of NIH/3t3 cells. (A) Suspensions of each clone in exponential growth phase were plated in DMEM containing 0.33% Bacto-Agar overlaid in 35 mm plates with 0.6% agar gel. The cells were incubated for 21 days and colonies were counted. (B) Clones in exponential growth were plated in each well of a six-well dish in selection media. The media was changed every 3–4 days, and at 8 days past confluence the cells were counted on a hemocytometer. The average number of colonies or cells per plate for each cell line was determined. The data represent the mean ± SEM from three separate experiments. (**) indicates p ≤ 0.01 when compared to clones E1, E2, DS1 and DS4 in . In , (α**) indicates p ≤ 0.01 as compared to clones E1 and E2, (β***) indicates p ≤ 0.001 as compared to clones DS1 and DS4, (χ*) indicates p ≤ 0.05 as compared to clone DS1, and (δ**) indicates p ≤ 0.01 as compared to clone DS4.
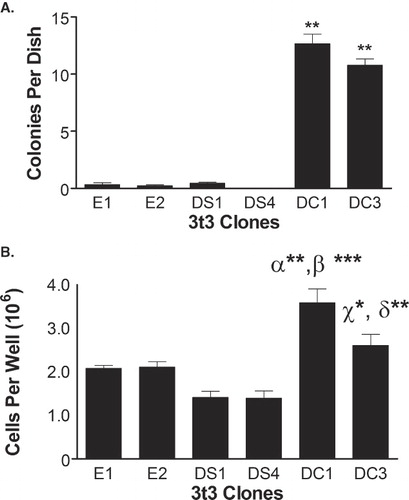
Figure 4. DHHC20 expression causes elevated proliferation in NIH/3t3 cells. E1 (-▪-), E2 (-□-), DS1 (-▴-), DS4 (-▵-), DC1 (-•-) or DC3 (-○-) cells were seeded onto 96-well plates (2,000 cells/well) in standard media on day 0. On day 1, the media was changed to DMEM containing 10% (A), 2% (B), or 1% (C) Bovine Serum. Plates were fixed at 24-h intervals and subjected to SRB staining and an absorbance reading at 560 nm. The data shown is the mean ± SEM of the absorbance at each time point for four separate experiments. (**) indicates p ≤ 0.01 compared to clones E1, E2, DS1 and DS4.
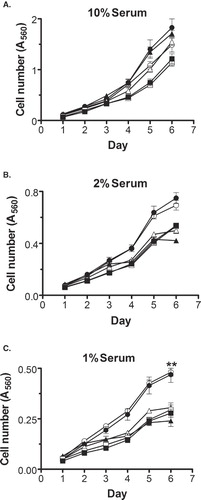
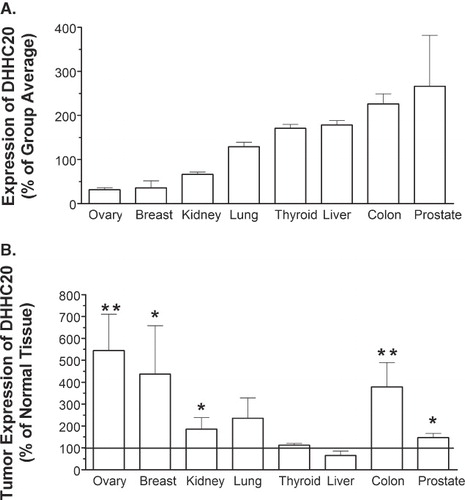
Figure 5. Expression of DHHC20 in normal human tissue and tumors. Lyophilized β-actin-normalized cDNA obtained in a 96-well format from Origene Technologies was amplified using a DHHC20-specific primer/probe. (A) Comparative expression of DHHC20 in normal tissue samples. The average Ct value for each tissue group was determined, and the % relative expression was calculated using the equation: % relative expression = (2-ΔCt) × 100, where ΔCt represents the difference in Ct for the tissue group vs. the average Ct for all tissue types. (B) Expression of DHHC20 in tumor vs. matched normal tissue. The average Ct value for each normal tissue and tumor-derived group was determined, and the % relative expression was calculated using the equation: % relative expression = (2 -ΔCt) × 100, where ΔCt represents the difference in Ct for the tumor-derived samples from the Ct for the normal tissue samples. Values represent the mean ± SEM of four experiments. For Panel B, (*) indicates p ≤ 0.05 and (**) indicates p ≤ 0.01.