Figures & data
Figure 1. Cross-linking of the NtpEF heterodimer. The affinity-purified NtpEF containing wild type forms of both polypeptides contains only a single natural cysteine, Cys116 which is the penultimate residue of NtpF. Wild type NtpEF modified at this site by BPM was irradiated with UV light, and samples were removed for analysis by SDS-PAGE at the times in minutes indicated. The position of the covalently-linked NtpEF heterodimer is indicated. M, mass standards (kDa).
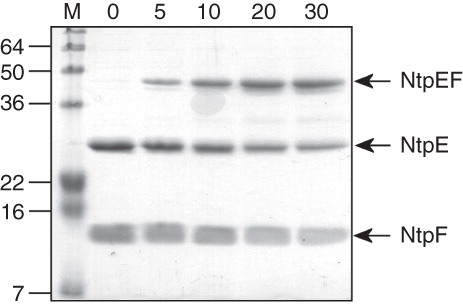
Table I. Estimates from circular dichroism of the secondary structure content of NtpE, NtpF, and NtpEF.
Table II. Identification of cross-linked NtpE-NtpF tryptic fragments.
Figure 2. SDS-PAGE analysis of benzophenone 4-maleimide-mediated cross-linking in the NtpEF heterodimer. Cysteine replacement mutants of NtpE (Cys21, Cys39, Cys57 and Cys75) were co-expressed with the ‘cysteine-less’ C116A mutant of NtpF and the corresponding NtpEF heterodimers were affinity purified. The mutant cysteine residues were reacted with the maleimide function of BPM, with subsequent UV photoactivation inducing covalent linkage to NtpF. SDS-PAGE analysis was performed on photoactivated (+) and non-photoactivated controls (−). High molecular mass species corresponding to cross-linked products were identified by tryptic fingerprinting. The band marked with an asterisk in the ECys57/FC116A and ECys75/FC116A is a minor contaminant of the affinity-purified NtpEF, identified as E. coli aminoglycoside 3-phosphotransferase.
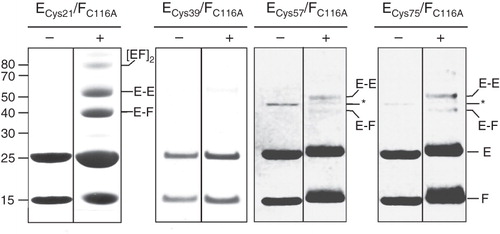
Figure 3. SDS-PAGE analysis of disulphide cross-linking of co-expressed NtpEF cysteine replacement mutants. To confirm protein-protein contacts involving the C-terminal region of NtpF, cysteine replacement mutants of NtpE (Cys115 and Cys122) were co-expressed with wild type NtpF containing a natural cysteine residue at its penultimate position (Cys116). Co-expression of wild type NtpE and NtpF (Ewt/Fwt) contains only the naturally-occurring Cys116 of NtpF, whereas expression of wild type NtpE with the NtpF C116A mutant (Ewt/FC116A) gives a control heterodimer completely devoid of cysteines. The corresponding NtpEF heterodimers were affinity-purified and incubated with oxidant (Ox), the dimaleimide cross-linker pDPM (DM), the reducing agent DTT (R), or left untreated (NR) before separation on SDS-PAGE. Identities of cross-linked species were confirmed by tryptic fingerprinting/mass spectrometry. The figure is a composite assembled from lanes run separately on gels under reducing (R, DM) or non-reducing (NR, Ox) conditions to avoid cross-contamination by reducing agent.
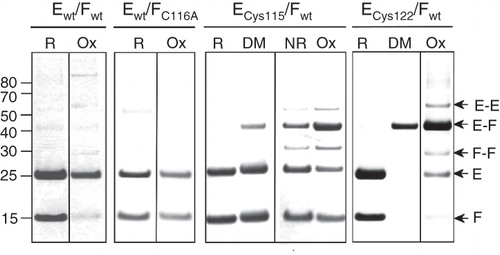
Figure 4. Immunoblot analysis of disulphide links between the Cys21 mutant of NtpE and NtpF N-terminal cysteine mutants. (A) A series of NtpF mutants containing single cysteine replacements in the N-terminal region were co-expressed with the Cys21 mutant of NtpE. To screen for disulphide cross-links that can form in vitro, samples enriched in the mutant NtpEF heterodimers were made from whole cell lysates of induced cells by pull-down with Talon His6 affinity resin. Proteins extracted from the resin into SDS-PAGE sample buffer were then treated with (+) or without (−) reducing agent before separation on SDS-PAGE and subsequent immunoblotting. The blot was developed with monoclonal antibody recognizing the His6 tag at the N-terminal end of NtpE. The strongly developed band at 25 kDa is NtpE and the weaker band at 37 kDa is the NtpE-NtpF heterodimer. (B) To confirm the disulphide formation between Cys21 in NtpE and Cys17 in NtpF suggested by the data in (A), the corresponding mutant heterodimer was affinity purified and incubated with oxidant (Ox), the dimaleimide cross-linker pDPM (DM) or with the reducing agent DTT (R), Cross-linked species were identified by tryptic fingerprinting/mass spectrometry.
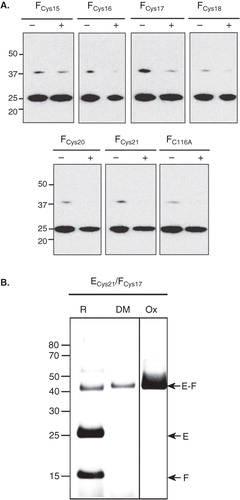
Figure 5. VMA4 cysteine replacement mutants complement the conditional lethal phenotype of the Δvma4 strain. Four-fold serial dilutions (left to right) of Saccharomyces cerevisiae Δvma4 strain transformed with plasmids carrying wild-type VMA4 (VMA4WT) or cysteine replacement versions of the subunit. The VMA4-deleted strain (Δvma4) showed no growth. Plates buffered to pH7.5 and containing both galactose to induce expression and raffinose to support growth were culture for 40 hours. Doubling time (d.t.) (in hours) is listed for each strain, determined by monitoring change in optical density at 600 nm for cells growing in liquid culture at pH7.5 with galactose/raffinose.
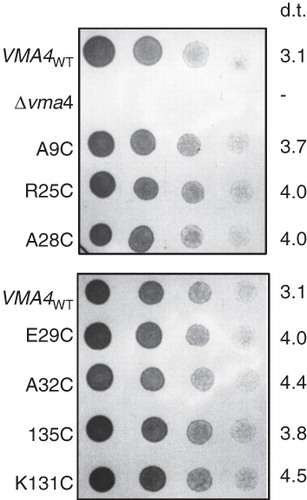
Figure 6. Immunoblot analysis of BPM-mediated cross-linking between subunits E, G and C in the yeast V-ATPase subunit E. (A) Vacuolar membranes from Saccharomyces cerevisiae cells expressing subunit E (Vma4p) cysteine replacement mutants were modified with BPM, then photoactivated or (+) or maintained in the dark (−). After detergent solubilization, V-ATPase was immunoprecipitated with monoclonal antibodies to subunit B and the precipitated proteins analyzed by immunoblotting. Top panel: Detection of Vma4p/subunit E. The background band seen in all samples results from recognition of the precipitating antibody IgG heavy chain by the immunblot secondary antibody. Lower panel: Detection of Vma10p/subunit G. Vacuolar membranes were analyzed directly since interference from immunoprecipitating antibody would obscure the signal from Vma10p cross-linked products. (B) Identification of the ∼ 65 kDa cross-linked product formed by the R25C Vma4p/E mutant. A photoactivation-dependent product with the same mass as the species detected with antibodies to Vma4p/E in (A) was also detected by immunoblotting with antibodies to subunit C, indicating formation of a Vma4p/E-Vma5p/C heterodimer. (C) Cross-linking of the C-terminal domain of Vma4p/E to Vma10p/G. BPM-mediated cross-linking between a cysteine introduced at position 131 in Vma4p/E and wild type Vma10p/G resulted in formation of a ∼ 36.5 kDa species detected by antibodies to both Vma4p/E (anti-E) and Vma10p/G (anti-G). Formation of this species was photoactivation-dependent (+) and absent from control samples maintained in the dark (−). An additional ∼ 60 kDa species was detected by the anti-Vma10/G antibody, but was not photoactivation-dependent, being found in both irradiated and non-irradiated samples containing wild-type proteins. (D) Determination of molecular masses of cross-linked species. Migration of the prestained markers, positions of which are shown in (A) and (C), are plotted against molecular mass on a log scale (closed symbols) and a straight line has been fitted to each data set to produce a standard curve of migration versus molecular mass for each immunblot (r > −0.99 in each case). Triangles, circles and squares are respectively the marker sets in (A) upper panel, (A) lower panel and (C). Migration of subunits Vma10p/G, Vma4p/E and the putative cross-linked E-G heterodimer for each of the blots in (A) and (C) are also plotted (shown by the horizontal dashed lines) and the intercept on the fitted line is indicated by the open symbols. The masses of the putative E–G heterodimers seen on each of the blots are very similar, as determined from the intercept on the abscissa.
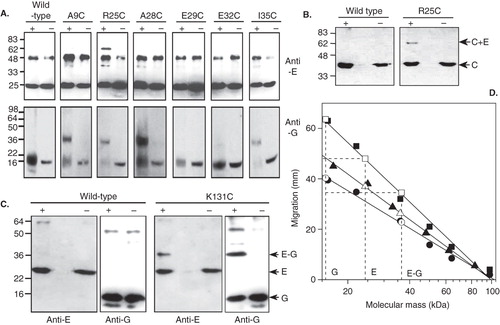
Figure 7. Modeling the subunit E/subunit G stator in the structure for the V-ATPase. The stator structures visible in the model of the Manduca V-ATPase generated by cryo-electron microscopy of single particles (Muench et al. Citation2009) are ∼ 160 Å long and extend from the top of the V1 domain to the horizontal collar of density partially encircling the mid-region of the complex that contains subunit C (pdb 1U7L (Drory et al. Citation2004): green in the on-line version of this figure). Stators 1 (S1) and 2 (S2), labeled according to (Muench et al. Citation2009), are visible in the view shown. The cytoplasmic end of stator 2 has been fitted with the mixed α-helix and β-sheet (red and yellow, respectively, in the on-line version of the Figure) of the crystal structure of the C-terminal domain (residues 81-198) of the Pyrococcus homologue of subunit E (pdb code 2DM9 [Lokanath et al. Citation2007]). The filament-like region of stator 2 (S2), extending towards the membrane domain V0, can accommodate the N-terminal domain of E modeled as an extended α-helix (red cylinders in the on-line version of the Figure), with a break predicted to be possible ∼ 60 Å from the membrane proximal end of the stator. The 115 residue subunit G is modeled into the stator structure principally as a single α-helical structure (blue cylinders in the on-line version of the figure) such that its N-terminal region is positioned close to the N-terminal region of E at the membrane-proximal end of the stator. In the subunit E C-terminal domain structure, the residue (Glu116) that corresponds to NtpE residue Leu115 that cross-links directly to the C-terminus of NtpF is shown in space fill (cyan in the on-line figure) and is adjacent to the C-terminal region of G, consistent with the cross-linking data from this study and published biophysical data (see main text for discussion). E and G can be equally well fitted to the other two stators. This Figure is reproduced in colour in the online version of Molecular Membrane Biology.
![Figure 7. Modeling the subunit E/subunit G stator in the structure for the V-ATPase. The stator structures visible in the model of the Manduca V-ATPase generated by cryo-electron microscopy of single particles (Muench et al. Citation2009) are ∼ 160 Å long and extend from the top of the V1 domain to the horizontal collar of density partially encircling the mid-region of the complex that contains subunit C (pdb 1U7L (Drory et al. Citation2004): green in the on-line version of this figure). Stators 1 (S1) and 2 (S2), labeled according to (Muench et al. Citation2009), are visible in the view shown. The cytoplasmic end of stator 2 has been fitted with the mixed α-helix and β-sheet (red and yellow, respectively, in the on-line version of the Figure) of the crystal structure of the C-terminal domain (residues 81-198) of the Pyrococcus homologue of subunit E (pdb code 2DM9 [Lokanath et al. Citation2007]). The filament-like region of stator 2 (S2), extending towards the membrane domain V0, can accommodate the N-terminal domain of E modeled as an extended α-helix (red cylinders in the on-line version of the Figure), with a break predicted to be possible ∼ 60 Å from the membrane proximal end of the stator. The 115 residue subunit G is modeled into the stator structure principally as a single α-helical structure (blue cylinders in the on-line version of the figure) such that its N-terminal region is positioned close to the N-terminal region of E at the membrane-proximal end of the stator. In the subunit E C-terminal domain structure, the residue (Glu116) that corresponds to NtpE residue Leu115 that cross-links directly to the C-terminus of NtpF is shown in space fill (cyan in the on-line figure) and is adjacent to the C-terminal region of G, consistent with the cross-linking data from this study and published biophysical data (see main text for discussion). E and G can be equally well fitted to the other two stators. This Figure is reproduced in colour in the online version of Molecular Membrane Biology.](/cms/asset/02f288a5-8b42-42d8-9a6f-49d6f0307efa/imbc_a_480166_f0007_b.jpg)