Figures & data
Figure 1. Ultrastructural imaging of enterocyte membranes. (a) Electron micrograph of the apical part of an enterocyte showing microvilli (MV) and the basolateral membrane (BM). (b,c) Larger magnification of cross-sectional view of microvilli (b) and the basolateral membrane (c). Bars: a. 500 nm, b. 100 nm and c. 200 nm.
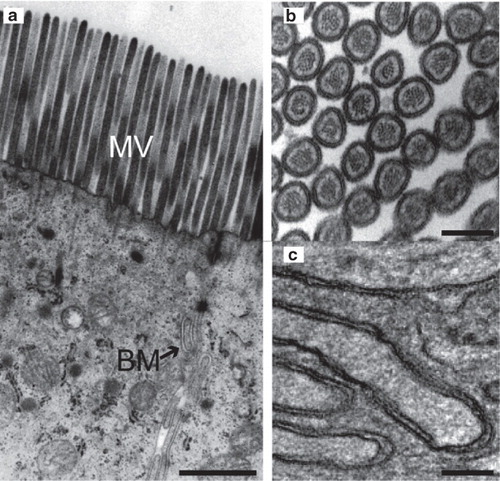
Figure 2. Thickness of basolateral and microvillar membranes. (a) Electron micrograph of the basolateral enterocyte membrane. (b) Intensity profile along the line shown in (a). Intensity values are inversely proportional to the degree of staining, i.e., low staining yields high intensity. Intensity minima reveal the location of the inner and outer leaflets of the membrane. (c) Inner and outer leaflets identified from several lineprofiles and overlayed as lines on the micrograph from (a). (d) Membrane thickness between the leaflets shown in (c). The average thickness value of the trace is indicated as t0. (e) Inner and outer leaflets identified in a microvillar membrane using identical approach as in (c). (f) Trace of the microvillar membrane thickness plotted along with the average value. (g) Distribution of membrane thickness for the basolateral membrane. The data show a pronounced Gaussian distribution of the measured membrane thickness. Data were fitted with a single Gaussian. (h) Examination of the microvillar membrane revealed a biphasic thickness distribution. The data were fitted with a double Gaussian. (i) Bar diagram representation of the mean membrane thickness obtained by fitting the distributions in (g) and (h). The error bars indicate the standard deviation of the mean obtained from the fits. Bars: 20 nm.
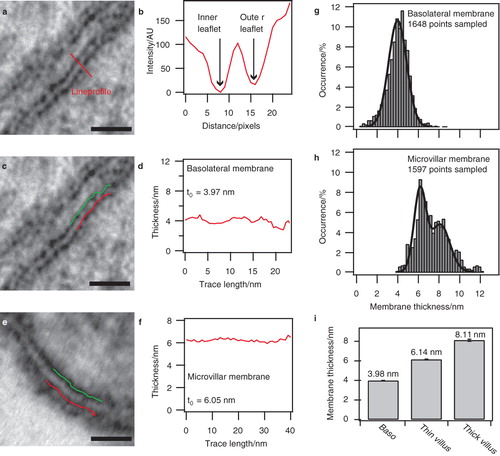
Figure 3. Thickness transitions in the microvillar membrane: (a) Sketch of the lipid bilayer membrane comprising the microvillar membrane of the enterocyte. (b-d): Thickness traces showing DIT/non-DIT transitions obtained from micrographs of microvillar membranes. Dashed lines mark the average thickness of non-DIT regions, whereas solid lines specify average DIT thickness.
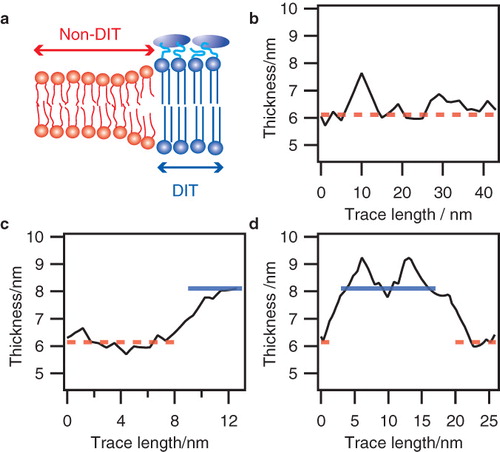
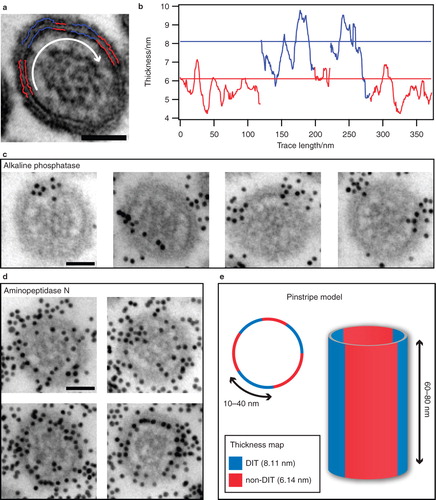
Figure 4. Superstructural organization of the microvillar membrane. (a) Cross-sectional view of a microvillus subjected to membrane thickness analysis. The average thickness of blue traces is closer to the DIT-level at 8.11 nm than the non-DIT at 6.14 nm, and vice versa for the red traces. (b) Membrane thickness as measured on the traces in (a) with horizontal lines at the DIT-level (blue) and non-DIT level (red). The white arrow in (a) indicates the direction of analysis. (c) Representative micrographs showing the spatial distribution of raft domains in microvilli, as visualized by immunogold-labelling of the raft-marker alkaline phosphatase. (d) Micrographs showing the homogeneous distribution of immunogold-labelled aminopeptidase N, which is known to partition equally into raft and non-raft membranes. (e) Model of DIT organization in microvilli. Cross-sectional view of microvillus with submicron DITs (blue) and non-DITs (red) dispersed in a pinstripe pattern. Bars: 50 nm.