Figures & data
Figure 1. (a) The fluorescence emission spectra of di-4-ANEPPDHQ in ordered (green) and disordered (red) model membranes. The unilamellar vesicles were formed from dioleoyl phosphatidylcholine (DOPC) (disordered phase) or a mixture of dipalmitoyl phosphatidylcholine (DPPC) and cholesterol (Chol) in the ratio 7:3 (ordered phase). The 60 nm blue-shift in fluorescence emission between the disordered and ordered phases was detected using spectrofluorimetry. The shaded regions show the spectral windows that were subsequently acquired for construction of the GP value images. (b) Schematic of the 2-channel ratiometric TIRF microscope. This Figure is reproduced in colour in the online version of Molecular Membrane Biology.
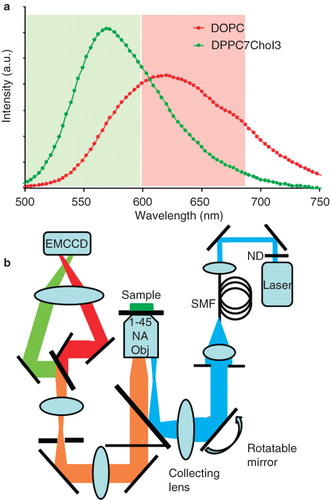
Figure 2. Membrane order at the synapse of live T cell-APC conjugates. (a) brightfield, (b) GP image and (c) 3D reconstruction showing en face view of the cell-cell interface (dashed line viewed from the direction of the arrow on b; APC position is indicated by dashed ring) of live di-4-ANEPPDHQ-stained Jurkat T cells forming synapses with unstained APCs (SEE-loaded Raji cells). (d, e and f) second example showing similar order distribution. APC (not shown) position in f is indicated with dashed circle and the other T cell is not shown for clarity (representative of n = 8). (g, h and i) and (j, k and l) show two examples of the synapses formed in the absence of antigenic stimulus (SEE; representative of n = 16). The total acquisition time for the 3D stack was approximately 30 sec with both images acquired approximately 10 min after synapse formation. In all images, red colour represents higher and green/blue lower order membranes. Scale bars 10 μm. T cell synapses imaged using optical tweezers: Brightfield (m) and GP image (n) of the activatory conjugate formed between Jurkat T cell and APC (as in a) with the IS oriented in the focal plane using optical tweezers. Representative line profile across the synapse (o) and quantitation of the GP values in the central and peripheral regions (n = 8, p < 0.05) (p). Scale bar 10 μm. This Figure is reproduced in colour in the online version of Molecular Membrane Biology.
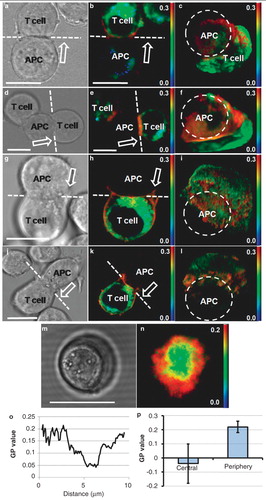
Figure 3. Order distribution at the T cell IS formed with activating antibody-coated glass coverslips. (a) Brightfield image showing the main cell body (outlined red) and the large synaptic interface (outlined yellow). (b) TIRF intensity image of the interface. (c) GP image at the synapse showing higher order (red) and lower order (green to blue) (representative of n = 20). (d) GP image of the interface formed by a primary human T cell (n = 6). Presented images are of a T cell approximately 10 min after formation of contact with activatory surface. (e) GP images showing dynamics of the observed order distribution (see also Supplementary Movie 1, available online). (f and g) GP images showing low- and high-order putative sub-synaptic vesicles (white arrows) diffusing in the plasma membrane background (see also Supplementary Movies 2 and 3, available online). Acquisition time was 1 sec per frame. (h) Quantitative analysis of GP values in the centre and periphery of Jurkat cell synapses (n = 20, p = 0.10) and a representative line profile across the contact site. Scale bars 5 μm. This Figure is reproduced in colour in the online version of Molecular Membrane Biology.
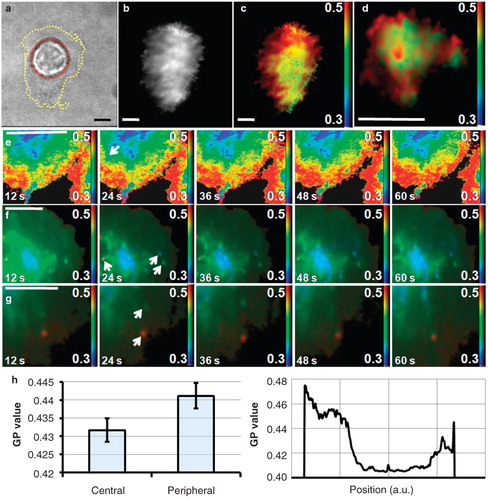
Figure 4. Effect of 7KC treatment on membrane order. (a and b) GP images of di-4-ANEPPDHQ-stained Jurkat T cells in suspension imaged using confocal microscopy without and after 7KC treatment, respectively. (c and d) TIRF GP images of the IS formed on an anti-CD3ϵ antibody-coated coverslip ∼ 10 min after contact formation without and after 7KC treatment, respectively. (e) Quantitation of membrane order in untreated and 7KC-treated T cell synapses (n = 20) showing reduced order after 7KC treatment (p < 0.001). Scale bars 5 μm. This Figure is reproduced in colour in the online version of Molecular Membrane Biology.
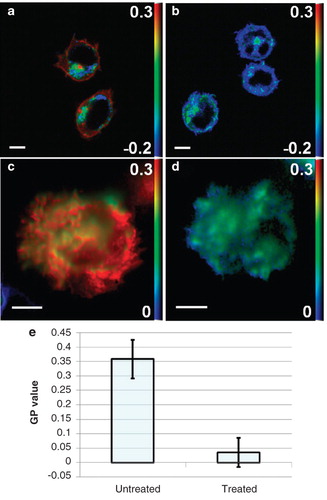
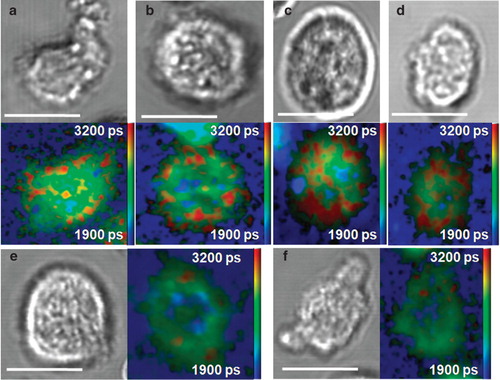
Figure 5. Representative order distributions at the IS formed by primary murine T cells activated on supported planar bilayers (n = 10). (a–d) Brightfield and FLIM images of di-4-ANEPPDHQ-stained primary T cells forming synapses on planar bilayers. (e and f) Brightfield and FLIM images of T cell synapses after treatment with 7KC. Colour bar represents the mean fluorescence lifetime fitted in each pixel (see Supplementary Material, available online). Scale bars 5 μm. This Figure is reproduced in colour in the online version of Molecular Membrane Biology.