Figures & data
Figure 1. Intracellular uptake, transport, processing, and excretion of NPs. (A) Schematic describing endo-lysosomal pathway (left) and RME process (right) of NPs inside the cell. NPs are internalized by receptor-mediated endocytosis and trapped in endosomes. These endosomes fuse with acidic organelles, lysosomes, for processing. Finally they are transported to the cell periphery for excretion. (B) TEM images capturing different stages of NP transport through the cell. Reproduced with permission from [Chithrani et al. Citation2006, Chithrani & Chan Citation2007, Jin et al. Citation2009].
![Figure 1. Intracellular uptake, transport, processing, and excretion of NPs. (A) Schematic describing endo-lysosomal pathway (left) and RME process (right) of NPs inside the cell. NPs are internalized by receptor-mediated endocytosis and trapped in endosomes. These endosomes fuse with acidic organelles, lysosomes, for processing. Finally they are transported to the cell periphery for excretion. (B) TEM images capturing different stages of NP transport through the cell. Reproduced with permission from [Chithrani et al. Citation2006, Chithrani & Chan Citation2007, Jin et al. Citation2009].](/cms/asset/c834d8ea-5d3c-4094-adc5-e32015c6cd6f/imbc_a_507787_f0001_b.jpg)
Figure 2. Dependence of cellular uptake of NPs as a function of size and shape. (A) Variation of cellular uptake of NPs as a function of size. (B) Model explaining the size- and shape-dependent cell uptake of NPs (spherical-shaped NPs = blue; cylindrical-shaped NPs = pink; comparison with the model put forward by Freund and co-wokers (green)). (C) Comparison of GNR uptake with their spherical counterparts (D) Shape-dependent cellular uptake of carbon nanotubes. Reproduced with permission from [Chithrani et al. Citation2006, Jin et al. Citation2009].
![Figure 2. Dependence of cellular uptake of NPs as a function of size and shape. (A) Variation of cellular uptake of NPs as a function of size. (B) Model explaining the size- and shape-dependent cell uptake of NPs (spherical-shaped NPs = blue; cylindrical-shaped NPs = pink; comparison with the model put forward by Freund and co-wokers (green)). (C) Comparison of GNR uptake with their spherical counterparts (D) Shape-dependent cellular uptake of carbon nanotubes. Reproduced with permission from [Chithrani et al. Citation2006, Jin et al. Citation2009].](/cms/asset/0e93696e-86a7-4a32-b6c9-7154bf7aa7dd/imbc_a_507787_f0002_b.jpg)
Figure 3. Dependence of cell uptake on surface charge. (A) Effect of surface charge of GNPs on cell uptake for SK-BR-3 cells. Inset schematics illustrate interactions between cell membrane interactions and GNPs with different surface charges (B) Effect of NP surface charge (top) and size (bottom) of NP on protein structure (top). Reproduced with permission from Vertegel et al. Citation2004, Aubin-Tam & Hamad-Schifferli Citation2005, and Cho et al. Citation2009.
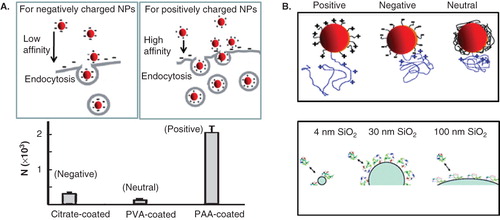
Figure 4. Transport properties of GNPs. (A,B) Transport properties of untargeted GNPs and GNRs, respectively (C) Top: Experimental setup used for tracking of transport in organelles; Bottom: comparison of diffusion properties of targeted GNRs in endosomes and lysosomes. Reproduced with permission from Huff et al. Citation2007, Chen et al. Citation2009, and Chithrani et al. Citation2009b.
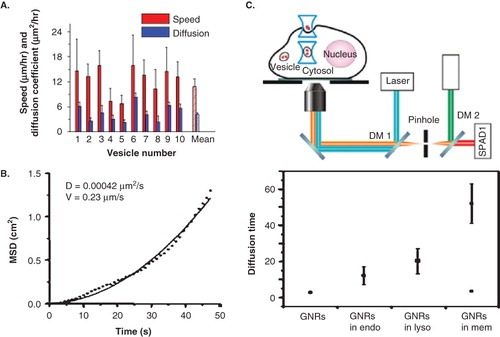
Figure 5. Distribution of GNPs and GNRs in organelles. (A,B) Schematic and experimental data describing the processing of GNPs and GNRs after endocytosis for MCF-7 and SK-BR-3 cells. [Lévy et al. Citation2004]. Reproduced with permission from Chen & Irudayaraj Citation2009, and Chithrani et al. Citation2009b.
![Figure 5. Distribution of GNPs and GNRs in organelles. (A,B) Schematic and experimental data describing the processing of GNPs and GNRs after endocytosis for MCF-7 and SK-BR-3 cells. [Lévy et al. Citation2004]. Reproduced with permission from Chen & Irudayaraj Citation2009, and Chithrani et al. Citation2009b.](/cms/asset/512c6fb8-50e9-4746-b2ec-ec9d76cad00a/imbc_a_507787_f0005_b.jpg)
Figure 6. Nuclear targeting of GNPs and GNRs. (A) Peptide-modified GNP complexes. Left: Illustration of the synthesis of peptide-modified colloidal GNP conjugates; Right: Visualization of targeted NPs in HepG2 cells by video-enhanced color differential interference microscopy. (B) PEG-modified GNPs functionalized with a combination of CPPs and NLS. Left: TEM image showing NPs localized in both nucleus and cytosol; Right: Variation of NPs in nucleus for a cell population. Reproduced with permission from Tkachenko et al. Citation2004 and Nativo et al. Citation2008.
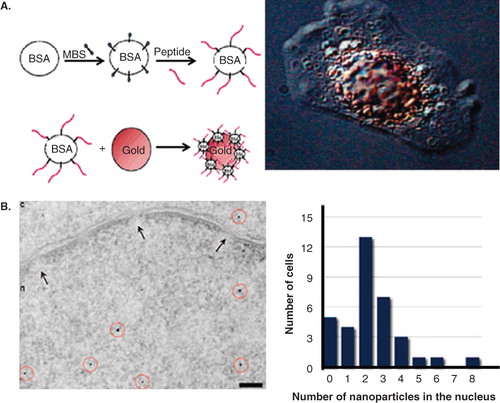
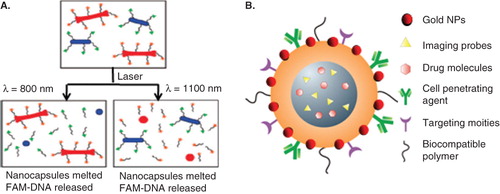
Figure 7. Applications of GNPs. (A) Schematic explaining selective release of drugs. DNA-conjugated GNRs with different aspect ratios for selective release of drug molecules using laser irradiation. (B) GNPs incorporated multifunctional NP-system with both therapeutic and imaging capability. Reproduced with permission from Wijaya et al. Citation2009.