Figures & data
Figure 1. Molecular structures of the investigated bile acids. (A) Formulas of the 6 bile acids. The first row shows the primary bile acids cholic acid and chenodeoxycholic acid, the second row the secondary acids deoxycholic acid and lithocholic acid, and the third row the conjugated forms of deoxycholic acid, glycodeoxycholic acid and taurodeoxycholic acid. (B) Molecular representations of the unconjugated bile acids investigated. Space filling models of the indicated bile acids are shown to highlight the differences in position of the hydroxyl groups in the bile acids. All bile acids have been oriented such that the hydrophilic face is shown. The carboxyl group is in the upper right corner, and the 3-OH group common to all bile acids is at the bottom. Cholic acid has 2 additional hydroxyl groups at the C7 and C12 positions; DOC and chenoDOC have 1 additional hydroxyl group at the C12 and C7 positions, respectively. Carbon atoms are shown in grey, hydrogen atoms in white and oxygen atoms in red.
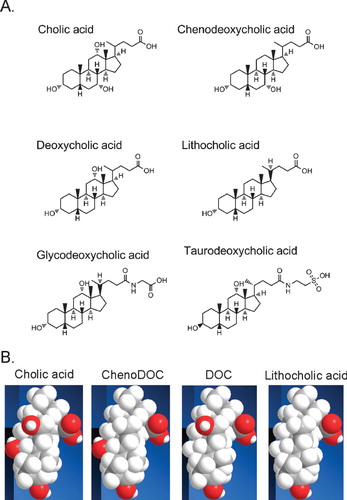
Figure 2. The OmpT porin is blocked by some of the investigated bile acids. A 20-s representative recording of a single OmpT trimer activity is shown in the absence (Control) or the presence of the indicated bath-applied bile acids at the highest concentration tested. These concentrations were: 0.008% (0.2 mM) DOC, 0.03% (0.76 mM) chenoDOC, 0.04% (0.85 mM) glycoDOC, 0.01% (0.19 mM) tauroDOC, 0.06% (1.47 mM) cholic acid, and 0.02% (0.53 mM) lithocholic acid. The current levels corresponding to three, two and one open monomer(s) are labeled O3, O2 and O1, respectively; the current level for the closed channel is labeled C. The pipette voltage is +50 mV.
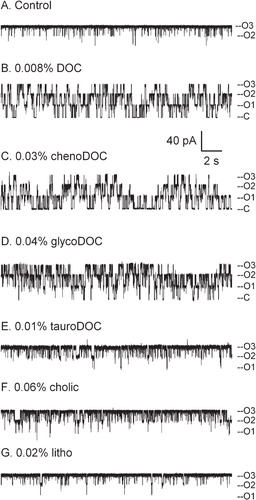
Figure 3. The bile acid mediated OmpT block is dose-dependent. The open probability of a single trimer was measured in the presence of various bath-applied concentrations of a given bile acid [Po(BA)] and in the absence of bile acids [Po(CON)] on the same patch, at +50 mV (pipette voltage). The graph plots the average (± SEM) of the ratio of such open probabilities (n > = 3) against bile acid concentration (in mM). In a few conditions, symbols do not have error bars because they represent only two experiments. The black line is a fit of the data in DOC to equation 1 (Materials and methods). The other lines of panel A are trend lines fitted through the points by eye (see text). The IC50s were found to be: 0.178 mM (0.007%) for DOC, 0.638 mM (0.025%) for chenoDOC and 1.282 mM (0.06%) for glycoDOC. In panel B, the individual data points are joined by lines to help visualization. The black horizontal line marks a Po ratio of 1.0.
![Figure 3. The bile acid mediated OmpT block is dose-dependent. The open probability of a single trimer was measured in the presence of various bath-applied concentrations of a given bile acid [Po(BA)] and in the absence of bile acids [Po(CON)] on the same patch, at +50 mV (pipette voltage). The graph plots the average (± SEM) of the ratio of such open probabilities (n > = 3) against bile acid concentration (in mM). In a few conditions, symbols do not have error bars because they represent only two experiments. The black line is a fit of the data in DOC to equation 1 (Materials and methods). The other lines of panel A are trend lines fitted through the points by eye (see text). The IC50s were found to be: 0.178 mM (0.007%) for DOC, 0.638 mM (0.025%) for chenoDOC and 1.282 mM (0.06%) for glycoDOC. In panel B, the individual data points are joined by lines to help visualization. The black horizontal line marks a Po ratio of 1.0.](/cms/asset/218c2b35-d2d8-4c06-9951-fc3b1e34bd43/imbc_a_519727_f0003_b.jpg)
Figure 4. The bile acid mediated OmpT block is voltage-dependent. The open probability of a single trimer was measured in the presence of a given bath-applied bile acid [Po(BA)] and in the absence of the bile acids [Po(CON)] on the same patch. The graph plots the ratio of such open probabilities at various voltages. The concentrations of bile acids were as follows: 0.006% (0.15 mM) DOC, 0.03% (0.76 mM) chenoDOC, 0.03% (0.64 mM) glycoDOC, 0.01% (0.19 mM) tauroDOC, 0.06% (1.47 mM) cholic acid, 0.02% (0.53 mM) lithocholic acid. A voltage-dependence is found for the effective bile acids (DOC, chenoDOC and glycoDOC), but not the ineffective ones (cholic, litho and tauroDOC), as highlighted by the solid horizontal line (Po ratio of 1).
![Figure 4. The bile acid mediated OmpT block is voltage-dependent. The open probability of a single trimer was measured in the presence of a given bath-applied bile acid [Po(BA)] and in the absence of the bile acids [Po(CON)] on the same patch. The graph plots the ratio of such open probabilities at various voltages. The concentrations of bile acids were as follows: 0.006% (0.15 mM) DOC, 0.03% (0.76 mM) chenoDOC, 0.03% (0.64 mM) glycoDOC, 0.01% (0.19 mM) tauroDOC, 0.06% (1.47 mM) cholic acid, 0.02% (0.53 mM) lithocholic acid. A voltage-dependence is found for the effective bile acids (DOC, chenoDOC and glycoDOC), but not the ineffective ones (cholic, litho and tauroDOC), as highlighted by the solid horizontal line (Po ratio of 1).](/cms/asset/eab8eaee-3f7a-4d7a-84cc-d7c3eda4f795/imbc_a_519727_f0004_b.jpg)