Figures & data
Figure 1. Schematic representation of the proteins used in this study. The translocator domains are shown with β representing the β-barrel domain (black box) and α representing the α-helix (hatched box); in the case of IgA protease, these assignments were based upon PSIpred secondary structure predictions [Bryson et al. Citation2005]. The surface-exposed N-terminal extension of the IgA protease TD is also indicated (vertically hatched box). The arrows indicate the natural processing sites. In the case of NalP, the exact position of the processing is not known and the approximate position is indicated. Numbers refer to the positions in the amino-acid sequences of the precursors of the wild-type proteins.
![Figure 1. Schematic representation of the proteins used in this study. The translocator domains are shown with β representing the β-barrel domain (black box) and α representing the α-helix (hatched box); in the case of IgA protease, these assignments were based upon PSIpred secondary structure predictions [Bryson et al. Citation2005]. The surface-exposed N-terminal extension of the IgA protease TD is also indicated (vertically hatched box). The arrows indicate the natural processing sites. In the case of NalP, the exact position of the processing is not known and the approximate position is indicated. Numbers refer to the positions in the amino-acid sequences of the precursors of the wild-type proteins.](/cms/asset/98b0ead7-9477-4ae0-809f-b2e960adf42e/imbc_a_550328_f0001_b.jpg)
Figure 2. In vitro folding of the TD variants of Hbp and NalP. (A) Heat-modifiability of refolded Hbp TD variants before (left panel) and after purification (right panel) was analyzed by semi-native SDS-PAGE. Inclusion bodies (IB) were incubated at 100°C and refolded samples either at 100°C (d) or at room temperature (n) prior to electrophoresis. F, folded form; U, unfolded form. The arrow indicates the processed form of Hbpβ13 after refolding, which is visible in the denatured sample. (B) Heat-modifiability of refolded NalP TD and NalP TDΔα. Samples were incubated at 100°C (d) or at room temperature (n) prior to electrophoresis. F, folded form; U, unfolded form. (C) Heat-modifiability of the in vitro folded NalP TDΔα digested by trypsin. Where indicated, the sample was incubated with 20 μg/ml of trypsin before SDS-PAGE analysis. (D) CD spectra of the in vitro folded Hbp (top) and NalP (bottom) TD variants. Numbers at the left of panels A-C refer to the positions of molecular mass standard proteins (in kDa).
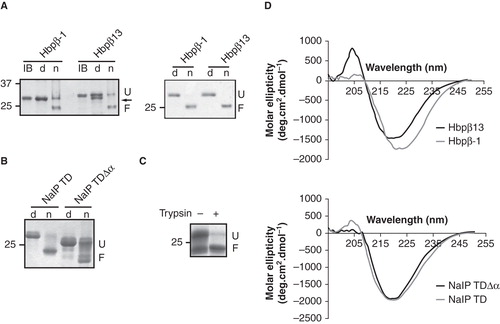
Figure 3. In vitro folded proteins form pores in proteoliposomes. (A) Swelling rates of proteoliposomes reconstituted with the indicated amounts of the tested proteins in an iso-osmotic solution of L-arabinose. (B) Relative swelling rates of proteoliposomes containing PorA, NalP TD, Hbpβ-1 or Hbpβ13 in solutions of sugars with different MW. The sugars used were arabinose (150 Da), glucose (180 Da), saccharose (342 Da), and maltose (360 Da). The data are shown relative to the swelling in arabinose and are the averages of at least three independent experiments. The swelling rate corresponding to 10% of that in arabinose was used to calculate the size of the channel.
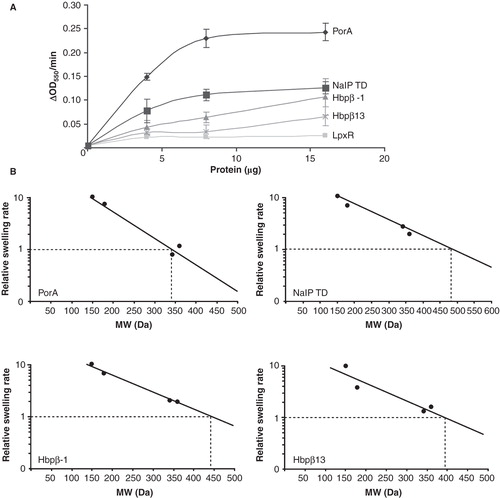
Table I. Pore sizes of the TDs measured.
Figure 4. Pore-forming activity of TDs in planar lipid bilayers. Pore activity was measured at an applied potential of 100 mV. In all panels, the zero-conductance level is indicated with a closed arrowhead (0 nS). (A) Recording for NalP TD. Conductance steps of 1.3 nS and of 0.15 nS are indicated by filled and open arrowheads, respectively, above the recording; the 1.45-nS level represents the simultaneous presence of an open 1.3-nS channel and an open 0.15-nS channel. (B-E) Recordings of Hbpβ-1 (B), Hbpβ13 (C), NalP TDΔα (D), and IgA TD (E). (F) The influence of polarity switching on the conductivity of the IgA TD channels. The moment of switching is indicated by the open arrowheads. The left panel shows a recording with an inversion of the polarity from positive to negative; immediately after the polarity switch a second 1.3-nS channel has opened that closes within a second, while one channel remains open. The right panel shows a recording with a reversion of the polarity from negative to positive; the channel, which had a conductance of 1.3 nS before the polarity switch, shows a conductance of 0.2 nS after the switch. (G) Small channels recorded for IgA TD after the polarity had been reversed from negative to positive.
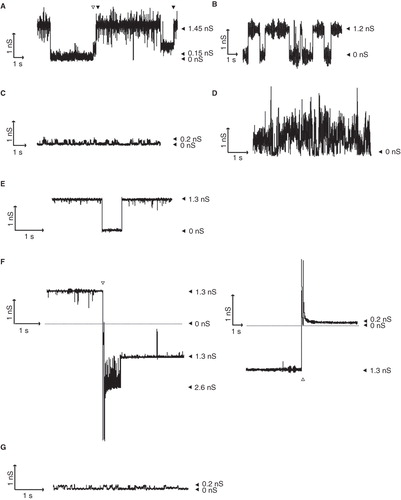
Figure 5. Stability of the TD β-barrels with and without α-helices. Chemical denaturation by GdnHCl was monitored by tryptophan fluorescence. AU, arbitrary units.
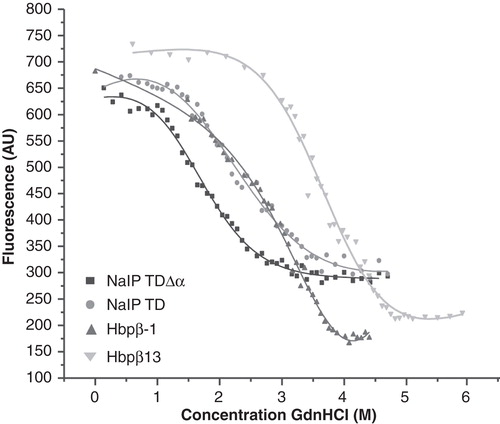
Table II. Calculated ΔG for chemical denaturation.