Figures & data
Figure 1. Representatives of the three surfactant families with rigid ring systems tested in this work: 4-(4′-propoxyphenyl)-trans-cyclohexyl-α-D-maltoside (PoPC-a-M), (1); trans-4-(4′-propylphenyl)cyclohexyl-β-D-maltoside (PPC-b-M), (2); trans-4-(trans-4′-propylcyclohexyl)cyclohexyl-α-D-maltoside (PCC-a-M), (3).
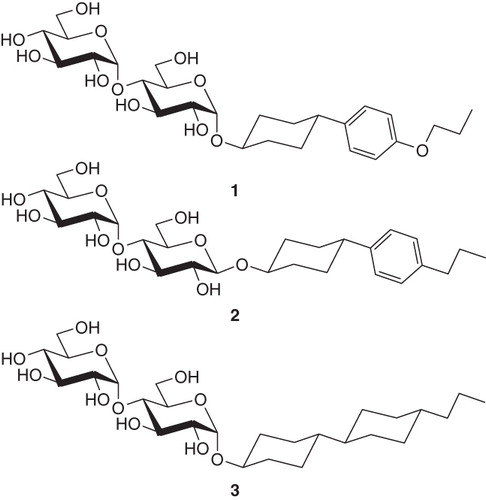
Table I. Physicochemical data of new surfactants and of C12-b-M.
Figure 2. Thermostability of β1AR34-324 in mild surfactants. The receptor was partially purified in C12-b-M by Ni2+-affinity chromatography with the surfactant exchange performed in the final column washes. The receptor was eluted in the relevant surfactant and the thermostability was immediately assessed by heating for 30 min, quenching on ice and measuring the amount of functional receptor remaining using a 3H-DHA binding assay (Supplementary information, available online): red squares, PCC-a-M, T50 = 40°C; yellow triangles, C12-b-M, T50 = 30°C; green inverted triangles, BPC-b-M, T50 = 25°C; blue diamonds, PPC-b-M, T50 = 21°C. The results shown are from a single representative experiment performed in duplicate with error bars representing the SEM. Other experiments performed using the surfactants above, but not all simultaneously, gave similar apparent T50-s.

Table II. T50 values (°C).
Figure 3. Thermostability of the human receptors of the Hedgehog pathway, hPtc and hSmo, in mild surfactants. Samples of hPtc or hSmo purified in C12-b-M, PCC-a-M, PPC-b-M or BPC-b-M were heated 30 min at increasing temperatures ranging from 4–70°C prior to injection on the reference flow cell (Fc1) and measure flow cell (Fc2) (coupled with N-SHh for hPtc and with CPN for hSmo experiments). Sensorgrams were recorded and the percentage of remaining native hSmo (a) and hPtc (b) was determined (SI). Red squares correspond to PCC-a-M; yellow triangles to C12-b-M; green inverted triangles to BPC-b-M and blue diamonds to PPC-b-M. The results shown are from a single representative experiment performed in triplicate with error bars representing the SEM. Several other experiments were performed and gave similar apparent T50-s.
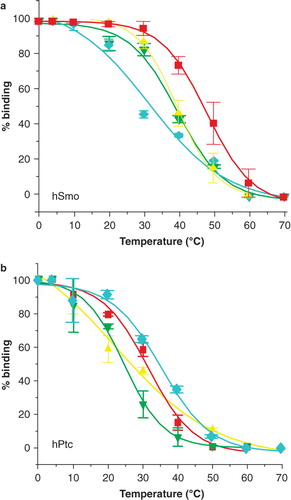
Figure 4. Stability of cytochrome b6 f exposed to low (0.2 mM) or high (5 mM) concentrations of either C12-b-M or PCC-a-M. (Top) Migration of the b6 f complex in sucrose gradients (10–30% w/w) prepared in 20 mM Tris/HCl buffer, pH 8.0, containing either 0.2 or 5 mM of either C12-b-M or PCC-a-M. Freshly prepared b6f (4.9 μM) in 0.2 mM C12-b-M [Stroebel et al. Citation2003] was layered on the top of the gradients and ultracentrifuged for 4 h at 4°C at 55,000 rpm (260,000 g) in a Beckman TLS 55 rotor. Monomerization, as observed in the presence of 5 mM C12-b-M, correlates with the inactivation of the complex (see references Breyton et al. Citation1997, Popot Citation2010). (Bottom) Kinetics of inactivation of the b6f complex in the presence of either 0.2 or 5 mM of either C12-b-M (circles, diamonds) or PCC-a-M (squares, triangles). The dimer bands were collected from the gradients and their electron-transfer activity assayed as described [Pierre et al. Citation1995] immediately after collection (t = 0) and after storage at 4°C in the dark for up to 10 days.
![Figure 4. Stability of cytochrome b6 f exposed to low (0.2 mM) or high (5 mM) concentrations of either C12-b-M or PCC-a-M. (Top) Migration of the b6 f complex in sucrose gradients (10–30% w/w) prepared in 20 mM Tris/HCl buffer, pH 8.0, containing either 0.2 or 5 mM of either C12-b-M or PCC-a-M. Freshly prepared b6f (4.9 μM) in 0.2 mM C12-b-M [Stroebel et al. Citation2003] was layered on the top of the gradients and ultracentrifuged for 4 h at 4°C at 55,000 rpm (260,000 g) in a Beckman TLS 55 rotor. Monomerization, as observed in the presence of 5 mM C12-b-M, correlates with the inactivation of the complex (see references Breyton et al. Citation1997, Popot Citation2010). (Bottom) Kinetics of inactivation of the b6f complex in the presence of either 0.2 or 5 mM of either C12-b-M (circles, diamonds) or PCC-a-M (squares, triangles). The dimer bands were collected from the gradients and their electron-transfer activity assayed as described [Pierre et al. Citation1995] immediately after collection (t = 0) and after storage at 4°C in the dark for up to 10 days.](/cms/asset/38b0bad7-a969-4905-8eeb-68758b154ac7/imbc_a_552440_f0004_b.jpg)
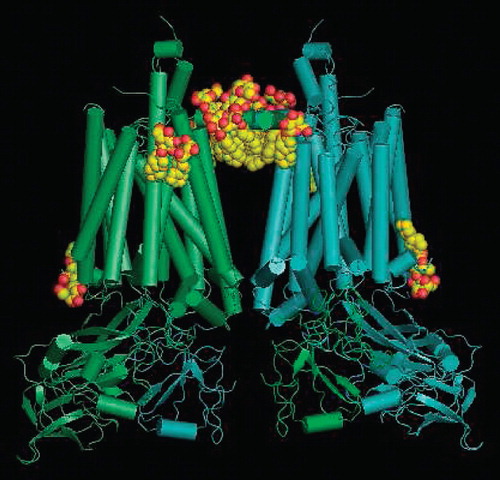
Figure 5. Crystal structure of the dimer of cytochrome b6f with the localisation of the structured PCC-a-M molecules (8 per monomer) seen from the membrane in CPK representation. The stromal side is at the top.