Figures & data
Figure 1. Structural model of class ST[3] transporters. Cylinders represent transmembrane segments. The homologous N and C domains were indicated in dashed boxes. VB and XA represent reentrant loops. Arrows point at the insertion/fusion sites of the BAD domain in the indicated hybrid proteins. Shown is the model for CitS of K. pneumoniae. GltS of E. coli lacks the first transmembrane segment. The N terminus of CitS is in the cytoplasm.
![Figure 1. Structural model of class ST[3] transporters. Cylinders represent transmembrane segments. The homologous N and C domains were indicated in dashed boxes. VB and XA represent reentrant loops. Arrows point at the insertion/fusion sites of the BAD domain in the indicated hybrid proteins. Shown is the model for CitS of K. pneumoniae. GltS of E. coli lacks the first transmembrane segment. The N terminus of CitS is in the cytoplasm.](/cms/asset/f745a21b-530a-4df5-86a6-19c108805d08/imbc_a_581252_f0001_b.jpg)
Figure 2. BAD-tagged CitS transporters. (A) Schematic representation of CitS-BAD hybrids. h, His6-tag; CitSN, N terminal domain of CitS; CitSC, C terminal domain of CitS. (B) Uptake of 14C-citrate by RSO membranes containing CitS (•), CitS-BAD1 (▴) and CitS-BAD260 (▪). Membrane protein concentrations were 1 mg/ml. Citrate uptake was expressed in nmol per mg of membrane protein in the sample. (C) SDS-PAGE of partially purified CitS moieties from the RSO membrane vesicles used in the uptake experiments shown in panel B. Lane 1, CitS, lane 2, CitS-BAD1, lane 3, CitS-BAD260, left lane, marker proteins. Molecular masses were indicated in kDa. Arrows at the right (from top to bottom) point at the BAD-tagged CitS moieties and CitS, respectively. (D) SDS-PAGE analysis after cross-linking of CitS moieties with glutaraldehyde. Samples of purified CitS, CitS-BAD1 and CitS-BAD260 were treated with 2 mM glutaraldehyde (GA) for 20 min in the presence and absence of 1% SDS as indicated at the bottom. Left lane, marker proteins with the molecular masses indicated in kDa. Arrows at the right (from top to bottom) points at dimeric CitS-BAD hybrids, dimeric CitS, monomeric CitS-BAD hybrids, and monmeric CitS.
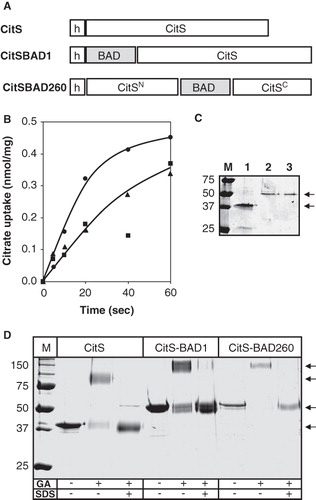
Figure 3. Titration of cross-linking of CitS and BAD-tagged CitS with glutaraldehyde. (A) SDS-PAGE analysis of purified CitS, CitS-BAD1 and CitS-BAD260 treated with the indicated concentration of glutaraldehyde (GA) for 10 min. m, monomeric protein bands; d, dimeric protein bands. (B) Densitometric analysis of the protein bands corresponding to monomeric and dimeric CitS (•,○), CitS-BAD1 (▴,Δ), CitS-BAD260 (▪,□). The data points were fitted to a sigmoidal curve after which the ‘begin’ and ‘end’ points of the curve were set to 100%.
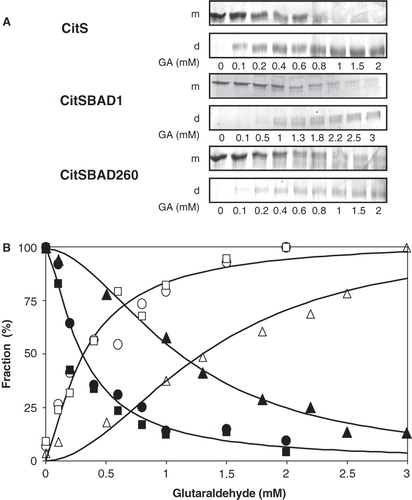
Figure 4. BAD-tagged GltS transporters. (A) Schematic representation of GltS-BAD hybrids. h, His6-tag. GltSN, N terminal domain of GltS. GltSC, C terminal domain of GltS. The star indicates the N356C mutation in GltS. (B) Uptake of 14C-glutamate by RSO membranes containing GltS (•), GltS-BAD206 (▴) and GltS-BAD1 (▪,□) before (▪) and after (□) treatment of the membranes with 1 mM NEM for 10 min. Membrane protein concentrations were 1 mg/ml. Glutamate uptake was expressed in nmol per mg of membrane protein in the sample. (C) SDS-PAGE of partial purified GltS moieties from the RSO membrane vesicles used in the uptake experiment shown in panel B. Lane 1, GltS, lane 2, GltS-BAD1, lane 3, GltS-BAD206, left lane, marker proteins. Molecular masses were indicated in kDa. Arrows at the right (from top to bottom) point at the BAD-tagged GltS moieties and GltS, respectively. (D) SDS-PAGE analysis after treatment of purified GltS (left), GltS-BAD206 (middle) and the BAD protein (right) with 2 mM glutaraldehyde (GA) for 20 min in the presence and absence of 1% SDS as indicated at the bottom. Left lanes, marker proteins with the molecular masses indicated in kDa. Arrows point at the monomeric protein bands.
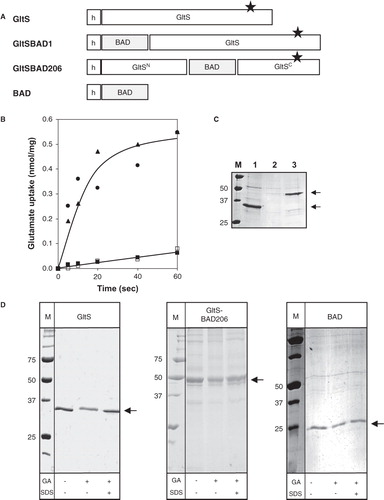
Figure 5. Fusions of TMSI of CitS to the GltS transporter. (A) Schematic representation of the TMSI-GltS and BAD-TMSI-GltS hybrids. h, His6-tag; BAD, BAD domain; H0, N-terminal plus TMSI of CitS; t, TEV protease cleavage site. The star indicates the N356C mutation in GltS. (B) Uptake of 14C-glutamate by RSO membranes containing TMSI-GltS (•,○) and BAD-TMSI-GltS (▪,□) before (•,▪;) and after (○,□) treatment of the membranes with 1 mM NEM for 10 min. Membrane protein concentrations were 1 mg/ml. Glutamate uptake was expressed in nmol per mg of membrane protein in the sample. (C) SDS-PAGE analysis after treatment of partially purified TMSI-GltS with 2 mM glutaraldehyde (GA) for 20 min in the presence and absence of 1% SDS as indicated at the bottom. Right lane, marker proteins with the molecular masses indicated in kDa. (D) SDS-PAGE analysis of partially purified BAD-TMSI-GltS treated with the indicated concentrations of glutaraldehyde (GA) for 10 min in the presence and absence of 1% SDS as indicated at the bottom. Left lane, marker proteins. Arrows from top to bottom point at the dimeric and monomeric protein bands, respectively.
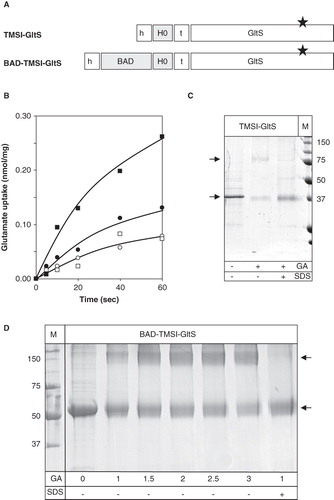
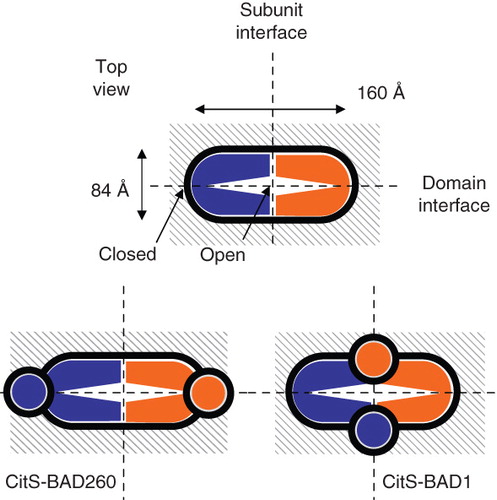
Figure 6. Relative orientation of the subunits in dimeric CitS and GltS. Schematic top view structures of dimeric wild type CitS (top), CitS-BAD206 (bottom left) and CitS-BAD1 (bottom right). Top view was defined as perpendicular to the membrane. The ‘closed’ and ‘open’ sides of the clam shell model of one subunit were indicated. The connection at the ‘closed’ side is formed by the central cytoplasmic loop. The N- and C-termini are positioned at the ‘open’ side. Dimensions are based upon EM projection structures. Vertical and horizontal dashed lines indicate subunit and domain interfaces, respectively. Circles in grey represent the BAD domains.