Figures & data
Figure 1. Ion channel recordings of p7 in PC-rich and PE-rich lipid environment. (A) Examples of channel recordings from p7 reconstituted into planar lipid bilayers of PC: PE (4:1) (left) and PC:PE (1:4) (right). Representative traces of p7 at different voltages reveal single channel openings of p7 (300 mM KCl, 5 mM K+-HEPES, pH = 7.0). The closed and open states are indicated by the black lines. The main and sub-conductance states are indicated by the black arrows. (B) Representative trace of a PC:PE (1:4) experiment showing two main and one sub-conductance state.
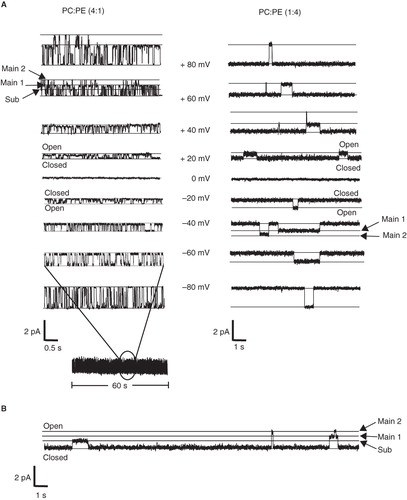
Figure 2. Analysis of p7 ion channel recordings in PC-rich and PE-rich lipid environment. (A) Representative current amplitude histograms of p7 reconstituted into bilayers containing PC: PE (4:1) (left panel) and PC:PE (1:4) (right panel). The traces were recorded at +30 mV. When reconstituted into bilayers of PC:PE (4:1) the channel opens to two main open states at 28.7 ± 1.4 pS standard deviation (SD) and 21.4 ± 1.3 pS (SD) and one sub-conductance states at 13.2 ± 1.4 pS (SD), respectively. When incorporated into bilayers of PC:PE (1:4) the channel opens to two main open states at 24.1 ± 0.6 pS (SD) and 17.8 ± 1.5 pS (SD), respectively. The sub-conductance state was detected at 10.4 ± 0.8 pS (SD). Each trace is derived from more than 1,500 single channel opening events. (B) I/V curve of the sub-conductance state and the two main-conductance states. The channel opens to three distinct conductance states in a voltage-independent manner. The mean standard error for each point is smaller than the size of the symbols. (C) Opening time histograms of p7 incorporated into PC-rich and PE-rich lipid bilayers. The mean opening times of p7 incorporated into bilayers containing 4:1 PC:PE and PC:PE (1:4) was 0.095 ± 0.018 s (SD) and 1.0 ± 0.32 s (SD), respectively.
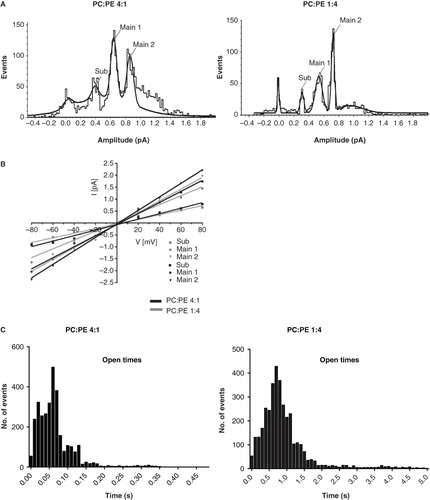
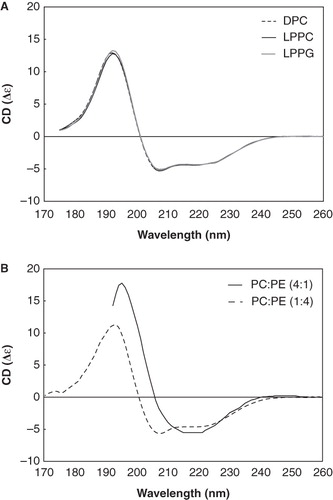
Figure 3. SRCD spectrum of p7 in different lipid environments. (A) SRCD spectra of p7 incorporated in DPC (dotted line), LPPC (thin solid line) and LPPG (thick solid line) detergents. (B) SRCD spectra of p7 in PC-rich (solid line) and PE-rich (dotted line) SUVs.