Figures & data
Figure 1. Total yield is dependent on the transformation method. (A) Immunoblot showing whole cell lysate for hAQP1, hAQP4 and hAQP8, respectively, from triplicate P. pastoris cultures. Chemical transformation is indicated by c and electroporation by e, respectively. Samples from different immunoblots are separated with a dashed line. (B) Bar graph showing the quantified production yield relative to the reference protein SoPIP2;1. The left bar indicates the total production yield of clones transformed using the lithium chloride method whereas the right bar shows clones transformed by electroporation.
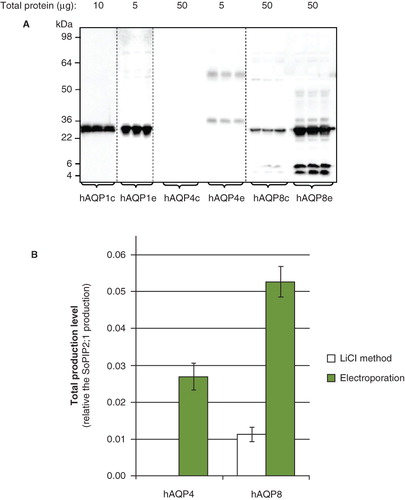
Figure 2. A high-zeocin growth screen can identify high-yielding clones. (A) Immunoblot showing the total production yield following a small-scale screen for the production of the hAQP1-hAQP8 fusion (F2) in P. pastoris. The corresponding growth on high zeocin is shown for each transformant just below the blot. (B) A screen where re-streaked cells are spread to find colonies which can survive high concentrations of zeocin. The left plate has been incubated for two days and the right plate for seven days. (C) A screen where equal amounts of cells resuspended in liquid medium are plated but in a different total volume. The left plate has been incubated for two days and the right plate for three days. (D) A screen where both the amount of cells and the volume of the drop have been adjusted. The left plate has been incubated for two days and the right plate for three days. This Figure is reproduced in colour in Molecular Membrane Biology online.
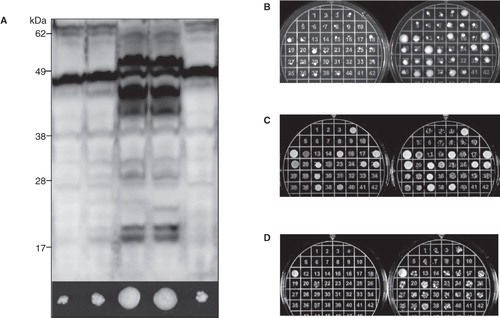
Table I. High zeocin screen on Pichia pastoris transformants The largest, densest colonies from a total of 40 (Fig. 2) are listed after different incubation times at 30°C.
Figure 3. Membrane localization of hAQP1 and hAQP8 in P. pastoris. Yield profiles for GFP fusion proteins of hAQP1 (A) and hAQP8 (B) in P. pastoris. Cells shown are from a culture at 48 h post-induction.
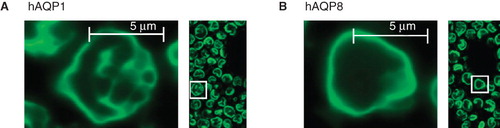
Figure 4. Mistic is not a good fusion partner in P. pastoris. (A) Fusion constructs of Opt-Mistic and human aquaporin homologues; M1 and M2. hAQP1 (yellow), hAQP8 (green) and the linker (light blue) are indicated. (B) Immunoblots showing the total production in whole P. pastoris cell extracts of Mistic fusions; M1 and M2; as well as individual fusion partners. Samples representing the total yield in P. pastoris are loaded in triplicates for each construct. The amount of total protein loaded for each construct is stated above each immunoblot. Samples from different immunoblots are separated with a dashed line. (C) Bar chart showing the total yields of Mistic fusions and individual fusion partners. All yields are relative to SoPIP2;1 production, for which the yield is set to one. Each bar represents the average from triplicate cultures. Error bars show the standard deviation (n = 3). This Figure is reproduced in colour in Molecular Membrane Biology online.
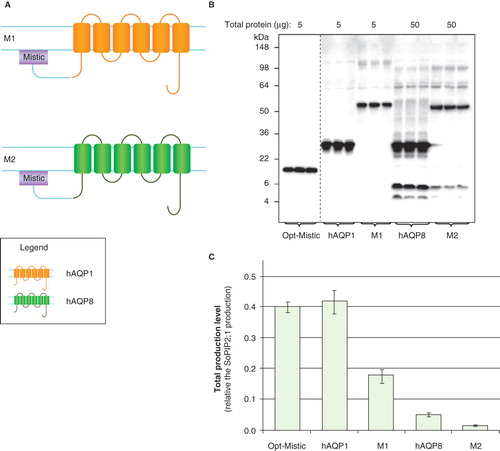
Figure 5. Production of hAQP1 fusions in P. pastoris. (A) Fusion constructs of human aquaporin homologues; F1 and F2. hAQP1 (yellow), hAQP8 (green) and the linker (light blue) are indicated. (B) Immunoblots showing the total yield in whole P. pastoris cell extracts of fusion constructs; F1 and F2. Samples representing the total production yield in P. pastoris are loaded in triplicates for each construct. The amount of total protein loaded for each construct is stated above each immunoblot. Samples from different immunoblots are separated with a dashed line. (C) Bar chart showing the total production yield of fusion constructs; F1 and F2, compared with hAQP8. All yields are relative the SoPIP2;1 production, for which the yield is set to one. The bars are the average of triplicate cultures; error bars show the standard deviation (n = 3). This Figure is reproduced in colour in Molecular Membrane Biology online.
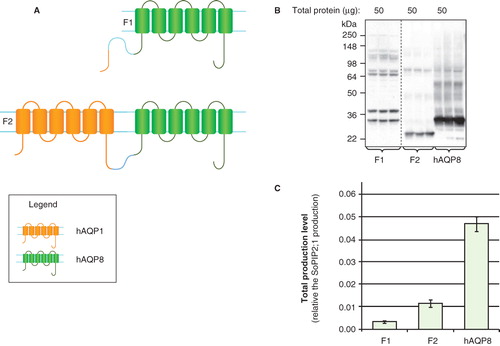
Figure 6. Production of hAQP chimeras in P. pastoris. (A) Chimeric constructs of aquaporin homologues; C1–C4. hAQP1 (yellow) and hAQP8 (green) are indicated. (B) Immunoblots showing the total production in whole P. pastoris cell extracts of chimeric constructs; C1–C4. Samples representing the total production yield in P. pastoris are loaded in triplicates for each construct. The amount of total protein loaded for each construct is stated above each immunoblot. All samples shown are from the same immunoblot, but the lanes have been re-ordered for clarity. (C) Bar chart showing the total production yield of chimeric constructs; C1–C4, compared with hAQP8. All yields are relative the SoPIP2;1 production, for which the production is set to one. The bars represent the average of triplicate cultures; error bars show the standard deviation (n = 3). This Figure is reproduced in colour in Molecular Membrane Biology online.
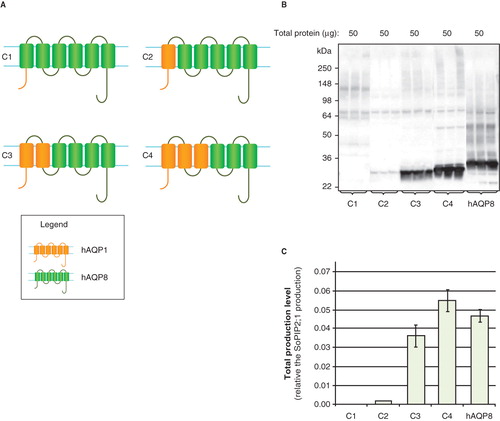
Figure 7. Production of hAQP domain swaps in P. pastoris. (A) Domain swaps of aquaporin homologues; S1 and S2. SoPIP2;1 (blue) and hAQP1 (yellow) are indicated. (B) Immunoblots showing the total production in whole P. pastoris cell extracts of domain swaps; S1 and S2. Samples representing the total production yield in P. pastoris are loaded in triplicate for each construct. The amount of total protein loaded for each construct is stated above each immunoblot. (C) Bar chart showing the total production yield of domain swaps; S1 and S2. All yields are relative the SoPIP2;1 production, for which the production is set to one. The bars represent average from triplicate cultures; error bars show the standard deviation. This Figure is reproduced in colour in Molecular Membrane Biology online.
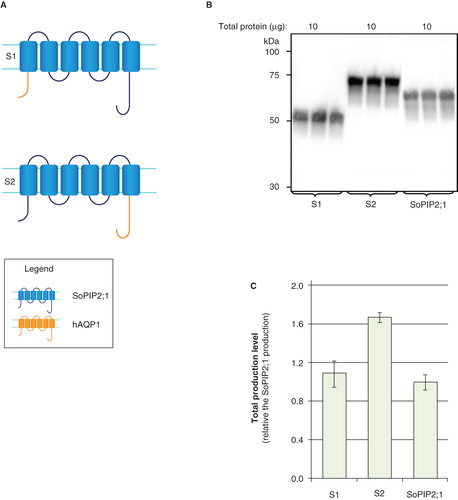
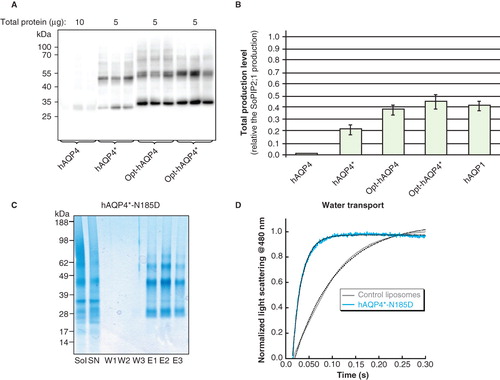
Figure 8. Production of gene optimized hAQP4 in P. pastoris. (A) Immunoblot showing the production of hAQP4, hAQP4*, Opt-hAQP4 and Opt-hAQP4*, respectively, in total cell extracts. Samples representing the total production yield are loaded in triplicates for each construct produced in P. pastoris. The amount of protein loaded for each target is indicated on top of the immunoblot. All samples shown are from the same immunoblot, but the lanes have been re-ordered for clarity. (B) Bar chart showing the yield of hAQP4*, Opt-hAQP4 and Opt-hAQP4*, respectively, compared with hAQP4 and related to the SoPIP2;1 yield, which is set to one. The bars represent the average of triplicate cultures; error bars show the standard deviation (n = 3). (C) Solubilization and purification of hAQP4*-N185D. A SDS-PAGE gel showing solubilized membrane (Sol), solubilized supernatant (SN), three washes (W1–3) and three elutions (E1–3) from the Ni-matrix. All bands in the eluted fraction were verified to be hAQP4 by mass spectrometry. (D) Activity measurements of hAQP4*-N185D reconstituted into liposomes and assayed using stopped flow and light scattering following a hyper-osmotic shift. This Figure is reproduced in colour in Molecular Membrane Biology online.