Figures & data
Table I. List of primers used to design the mENT1 serine to alanine subsitution mutants. All primers are shown in the 5′–3′ direction.
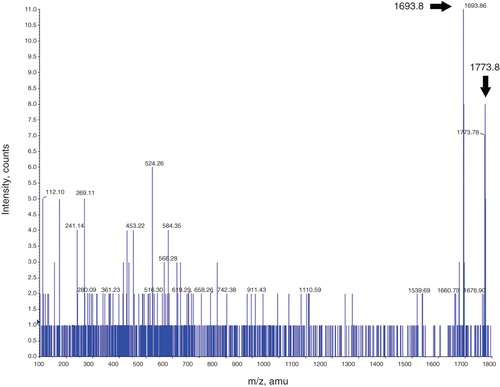
Figure 1. In vivo 32PO4- labeled N-3 × FLAG-hENT1 and mENT1 extracted from crude lysates and total-membrane enriched lysates. (A) Anti-3 × FLAG immuno-detection of tagged recombinant proteins from crude lysates prepared from non-labeled cells (1.2 μg total protein per lane). Lane 1: GFP-hENT1 (diamond) detected with anti-GFP antibodies. Lane 2: GFP-hENT1 (negative control). Lane 3: N-3 × FLAGMEKK3 (positive control, square). Lane 4: N-3 × FLAGhENT1 (triangle). Lane 5: N-3 × FLAG-mENT1 (circle). Putative dimers or protein complexes of ENT1s (double symbols) are present along with hENT1 aggregated/variably glycosylated products (between the 47–83 kDa markers). (B) Autoradiograph of FLAG-purified 32PO4-labeled recombinant proteins from crude cell lysates. Lane 1: 32PO4- labeled N-3 × FLAGMEKK3 (positive control). Lane 2: GFP-hENT1 (negative control). Lane 3: 32PO4- labeled N-3 × FLAG-hENT1. Lane 4: 32PO4- labeled N-3 × FLAG-mENT1. Presence of 32PO4- labeled recombinant protein is emphasized with dashed bars. Each lane was loaded with equal amounts of purified protein. (C) Autoradiography establishes the presence of 32PO4- labeledN-3 × FLAG-hENT1 and mENT1, purified from total membrane enriched lysates. 32PO4- labeled protein is indicated by dashed bars. Lanes 1 and 2: N-3 × FLAG-hENT1, ∼ 10 μg and 2.5μg. Lane 2: Loaded with less labeled protein to avoid interference by film overexposure. Monomeric and putative dimer complexes are observed as broad bands indicated by filled single and double symbols, while aggregated/ variably glycosylated products are present as dark smears. Lane 3: N-3 × FLAG-mENT1, ∼ 10 μg total protein. Representative images are shown based on five independent experiments with similar results.
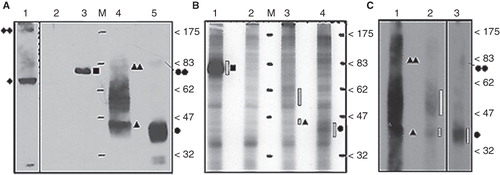
Figure 2. Phosphoamino acid analysis using of 32PO4 - labeled 3 × FLAG-mENT1 and 3 × FLAG-hENT1. Hunter Thin Layer Electrophoresis of 3 × FLAG-mENT1 and 3 × FLAG-hENT1. Samples stained with ninhydrin show the location of non-radiolabeled phosphoamino acid standards (Serine – S, Threonine – T or Tyrosine – Y). Autoradiographs show the position of 32PO4 - labeled amino acids. The phosphorylated residues were determined by comparing the autoradiograph to the ninhydrin stained standards and these data suggest that phosphorylation occurs on serines for both 3 × FLAG-hENT1 and 3 × FLAG-mENT1. Additionally, a weak signal is seen for threonine for 3 × FLAG-mENT1. Labeled inorganic phosphate (32Pi), a sample processing degradation product, was also observed. Representative images are shown based on two independent experiments.
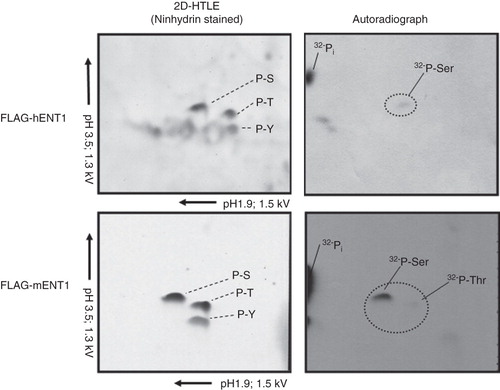
Figure 3. ClustalW alignment of 3 × FLAG-hENT1 and 3 × FLAG-mENT1. The 3 × FLAG-tag is indicated with a box while the transmembrane domains are indicated in gray. The 12 predicted serine targets are indicated with boxes. High identity of residues is indicated as (*) while high homology is indicated as (:).
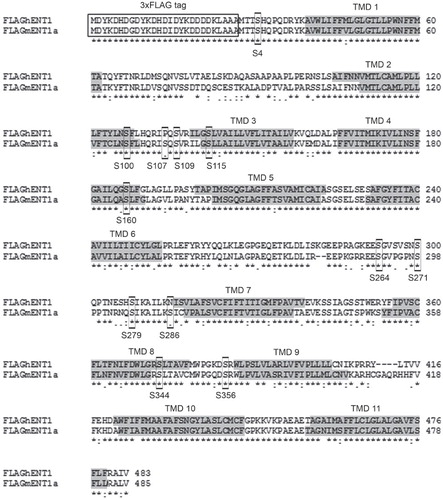
Figure 4. In vitro kinase assays of the Ub-mENT1 and Ub-hENT1 large intracellular loop peptides using PKA or PKC. Peptides of the large intracellular loops were tested for phosphorylation activity using PKA (A) or PKC (C) and as a negative control, an untreated sample (U). Coomassie blue stained gels confirm equal loading. The soluble protein, histone 1.2, was used a positive control and shows phosphorylation by PKC and PKA. To determine whether the kinases were able to label the ubiquitin tag at the N-terminal end of each peptide, the ubiquitin backbone alone was tested for phosphorylation activity. No signals are seen demonstrating that the ubiquitin backbone does not contribute to phosphorylation of the peptide. Autoradiography of the hENT1 and mENT1 peptides indicates that both are phosphorylated by PKA and PKC. Assays were conducted twice with identical results. Representative images are shown based on two independent experiments.
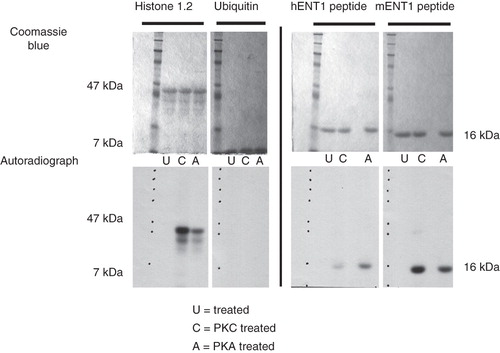
Figure 5. In vitro PKA and PKC kinase assays of single residue substitution mutants of the large intracellular loop peptide. Single mutations were introduced into the mENT1 loop peptide to substitute each of the four predicted serine residues and the one predicted threonine residue with an alanine. All mutants were subsequently subjected to an in vitro kinase assay using PKA or PKC to determine whether the mutation affects phosphorylation. The ubiquitin back bone was used as a negative control. (A) Autoradiography and densitometric analysis show that no single mutation affects the ability of PKA to phosphorylate mENT1 compared to control. (B) Autoradiography and densitometric analysis show that mutations in serines 264 and 271 do not affect phosphorylation of mENT1, by PKC, when compared to control. However, mutation of threonine 274, serine 279 or serine 286 does result in a significant decrease in phosphorylation compared to control. (*) p < 0.001 versus positive control, (^) p < 0.001 vs. T274 and (#) p < 0.01 vs. T274. Values are based on three independent experiments and are represented as mean ± SEM.
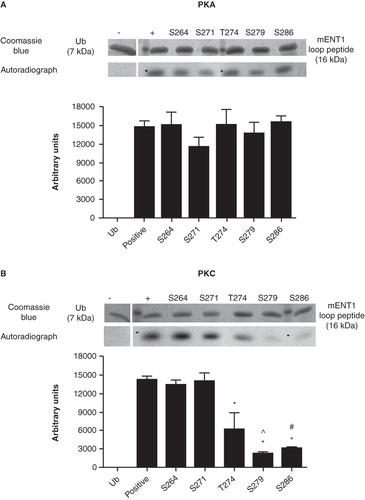
Table II. NetPhosK 1.0 prediction results for the mENT1 loop peptide. Predictions of putative phosphorylation sites within the mENT1 large intracellular loop for both PKA and PKC. Confidence scores are listed for each residue with the highest possible confidence equal to 1.0 and the lowest equal to 0.0. Residues at putative consensus sites scoring above the arbitrary confidence limit of 0.5 are shown in bold. Residues that have been shown to have an importance in phosphorylation in vitr o are indicated with a star.
Figure 6. Mass spectrometry analysis of the mENT1 intracellular loop peptide treated with PKA. A representative image is shown of the spectrum obtained following tryptic digest of PKA treated mENT1 loop peptide. The 1693.8 peak is indicated with a black arrow and represents the sequence REESGVPGPNSPPTNR. MASCOT MS/MS analysis of this peak resulted in a high score value for this sequence and matched it to endogenous mENT1. The second peak obtained in this spectrum was 1773.8 which results from the 80 dalton shift following addition of a single phosphate group. The 1773.8 peak is significantly lower in intensity compared to the 1693.8 peak due to the high intensity of the 1693.8 peak however this peak is clearly present and above background when magnified (see inset).
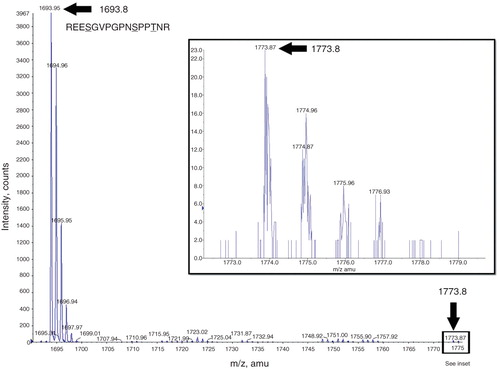
Figure 7. MS/MS analysis of the 1773.8 m/z peak. A representative image of MS/MS analysis of the 1773.8 m/z peak obtained from tryptic digest of the mENT1 peptide following PKA treatment. In this spectrum, both the 1773.8 and the 1693.8 peak are visible which would suggest both the phosphorylated and unphosphorylated forms of the REESGVPGPNSPPTNR fragment. Despite obtaining both peaks, MASCOT MS/MS analysis was unable to match the 1773.8 peak to the mENT1 sequence.