Figures & data
Figure 1. Schematic representation of the anticipated stages the N terminus of VP1-N from Polio virus may face during viral entry (stages I–IV). VP1-N encounters a virus bound stage (stage I, dark grey) which is not considered in this study. Stage II represents an aqueous environment, while the following stages represent the protein inserted into the membrane (stage III) or attached to the surface of the membrane (stage IV). Stages II–IV are represented by light grey rods. The arrow points from the N to the C terminus.
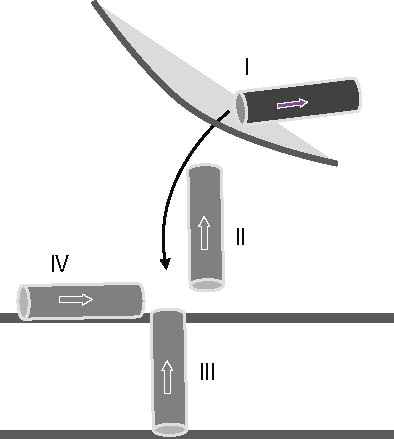
Figure 2. Root mean square deviation (RMSD) of the Cα backbones of the peptides referring to the starting structure. Data for VP1-N and FP1–33 are shown in the left and right columns, respectively. The rows are aligned to represent a gradual insertion of the peptides into the lipid membrane. Helices are aligned either parallel (A) or perpendicular (B) to the membrane normal. For parallel alignment (A): (I) touches the membrane, (II) half inserted, (III) deeper than half in the membrane, (IV) fully inserted into the membrane and (V) extended 100 ns MD simulations for alignments (III) and alignment (IV) with Run1 of VP1-N and Run2 of FP1–33. For perpendicular alignment (B): (I) float on membrane, no lipid molecules are removed, (II) embedded in one leaflet, and (III) fully embedded in middle of membrane. For the latter two cases lipid molecules are removed. Peptides A and B represent two peptides of the same kind simulated in a single membrane. Runs 1 and 2 are the same simulation box run twice. For the simulations semi isotropic pressure coupling has been used.
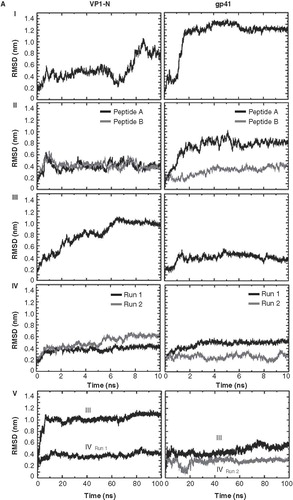
Figure 3. Snapshots of VP1-N and FP1–33 at various starting-positions in respect to the lipid bilayer: N-terminus towards the membrane (A), half inserted (B), deeper than half in the membrane (C) and fully inserted (D). Each panel shows VP1-N at 0 ns (top) and 10 ns (middle), as well as FP1–33 at 10 ns (bottom) for (A) and (B). (C) and (D) show structures after 100 ns instead of 10 ns. The protein backbone is shown in red, the side chains in stick modus and transparent van der Waals spheres. VP1-N-Gly-1 and FP1–33-Ala-1 are shown in blue and green, respectively, van der Waals spheres. Boundaries of the lipid bilayer are represented by the phosphorous atoms of the lipid headgroups (grey spheres). Water molecules are shown as blue triangles in a ball-stick modus. Graphics are generated using MOE.
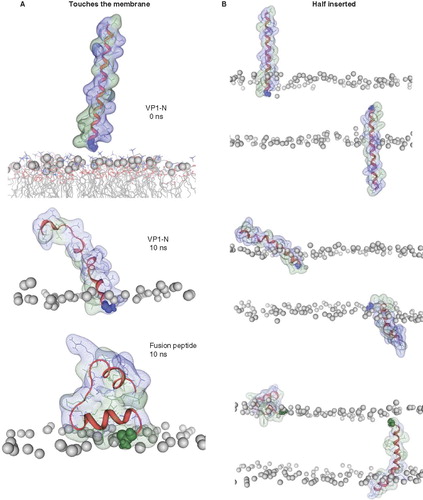
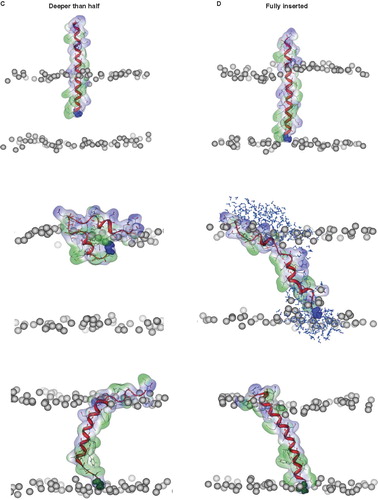
Figure 4. Snapshots of VP1-N and FP1–33 positioned with the helix axis parallel to the membrane surface named ‘floating on membrane’ (A). Snapshots of the peptides floating on the membrane at different rotations: VP1-N (B) and FP1–33 (C). For both peptides the left panel represents the conformation at 0 ns, the right panel the conformation after 10 ns, both peptides half (D) and fully inserted (E). The protein backbones are shown in red, the side chains in stick modus and transparent van der Waals spheres. Each panel shows VP1-N at 0 ns (top) and 10 ns (middle), as well as FP1–33 at 10 ns (bottom). VP1-N-Gly-1 and fusion-peptide-Ala-1 are shown in blue and green, respectively, van der Waals spheres. Boundaries of the lipid bilayer are represented by the phosphorous atoms of the lipid head groups (grey spheres). Graphics are generated using MOE.
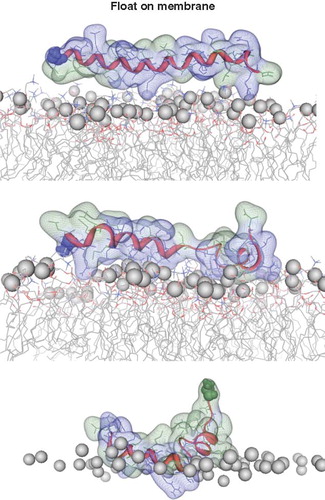
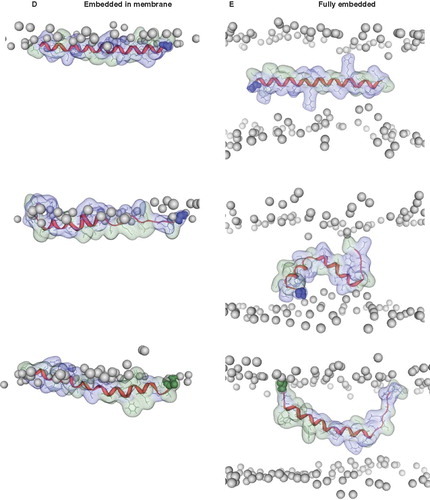
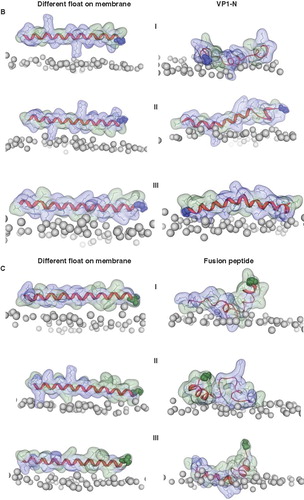
Figure 5. Representative conformations of VP1-N from the MD simulations when fully inserted (A) and fully embedded (B). Peptide backbone is shown in red, the side chains in ball and stick representation. Nitrogen atoms are shown in blue, oxygen atoms in red. The phosphorous atoms of the lipid molecules are represented by grey spheres. Graphics are generated using MOE.
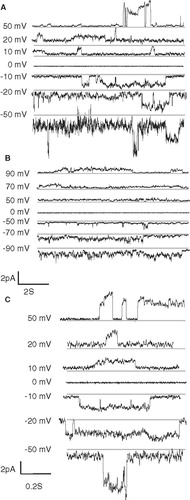
Figure 6. Channel recordings of VP1 (A) and FP1–33 (B) inserted into artificial lipid bilayers at various holding potentials. Selected traces of the recordings with VP1 are outlined (C). Grey lines in the recordings indicate the lowest detected current rather than marking the zero current line of the recordings.