Figures & data
Figure 1. Phylogenetic tree of the 13 human aquaporins. Aquaporins giving a high protein yield are shown in black boxes, poor yield in grey boxes, and proteins with a yield below the detection limit in the quantitative production screen are shown without any boxes. This Figure is reproduced in colour in Molecular Membrane Biology online where high protein yield is shown in green boxes and poor yield in orange boxes, respectively.
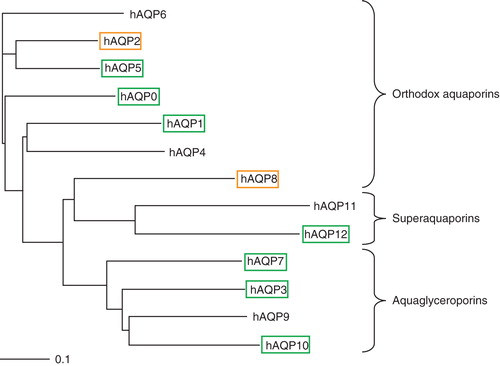
Figure 2. The screen on high Zeocin concentration. (A) Immunoblot showing the yields from the small scale production screen as compared to growth of the corresponding transformants on high Zeocin concentrations (2000 μg/mL), shown underneath. There is a clear correlation between large colonies grown on high Zeocin and the production yield analyzed by immunoblot. (B) Variation between the growth control (GC), SoPIP2;1, in five different experiments. The same control clone of SoPIP2;1 was cultured in five independent experiments (n = 3), over several years, and the production yield was estimated from independent immunoblots.
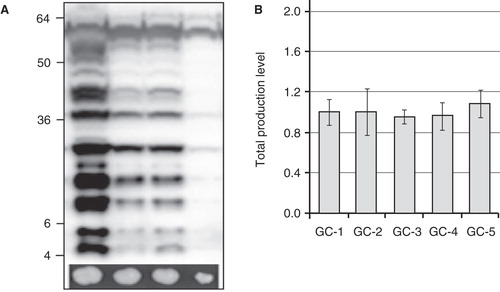
Figure 3. Production of the human aquaporin homologues in P. pastoris. (A) Bar chart showing the total production level of the human aquaporins homologues produced in the host P. pastoris relative the SoPIP2;1 production, for which the production is set to one (shown in grey). The y-axis represents the average from triplicate cultures and error bars show the standard deviation (n = 3). (B) Bar chart showing the membrane localized fraction for the hAQPs produced in the quantitative production screen. The typical membrane insertion is shown for the reference protein SoPIP2;1. The aquaporins are grouped by their position in the phylogenetic three (). This Figure is reproduced in colour in Molecular Membrane Biology online where Orthodox aquaporins have blue bars, Aquaglyceroporins red bars and Superaquaporins green bars, respectively.
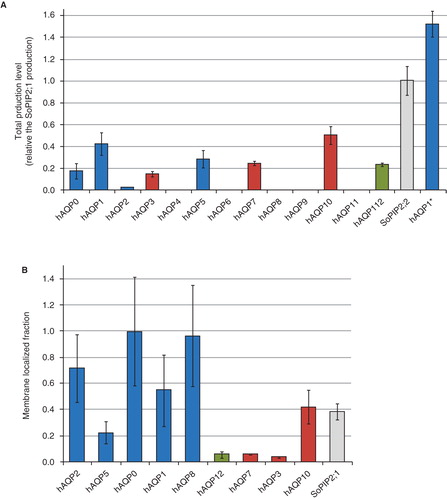
Table I. Table showing the recombinant yield and sub-cellular localization in the native membrane for the different aquaporins found in mammalians. The localizations have been extracted from the shown references, but they are also stated, with only minor differences, in a review (King et al. Citation2004).
Table II. Table showing the osmotic water permeability (Pf) for hAQP4m-N185D (Oberg et al. Citation2011a), hAQP5 (unpublished work: F. Öberg, J. Sjöhamn, and K. Hedfalk), hAQP10 (Oberg et al. Citation2011b and unpublished work: F. Öberg, J. Sjöhamn, and K. Hedfalk), and hAQP1 (Nyblom et al. Citation2007). The Pf for the control liposomes in each experiment is shown just before each protein sample.
Table III. Table showing protein production yields for all human AQPs overproduced in P. pastori s. The hAQPs are listed based on their production level, starting with the hAQP giving the highest yield. The silent mutations introduced in the second codon are underlined. The original sequence is given in brackets. The two smallest nonpolar residues (alanine and glycine) in the second position are underlined.
Figure 4. The influence of the second triplet on the production yield. Bar chart showing the total production yield for (A) two hAQP8 constructs with mutations in the +4 position, and (B) three hAQP1 constructs with mutations in the +6 position. Variations in the nucleotide sequence for the second codon are shown in brackets. All constructs have a C-terminal 6× histidine tag and some have the additional myc tag in the C-terminus, as shown in the figure. Production is relative to the SoPIP2;1 production, for which the production is set to one. The y-axis represents the average from triplicate cultures and error bars show the standard deviation (n = 3). This Figure is reproduced in colour in Molecular Membrane Biology online.
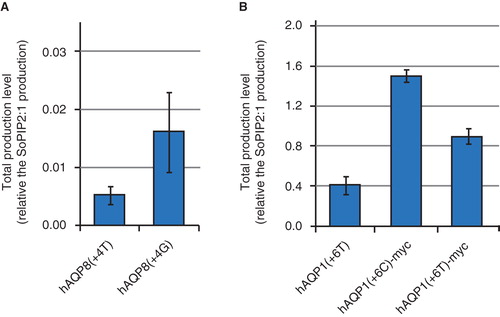
Figure 5. The folding of human aquaporin 1. (A) Topology maturation for hAQP1 with a four spanning intermediate (left) and the mature fold with six TMD (right) (Lu et al. Citation2000). Asn49 and Lys51 in the N-terminal part of TMD2 (their position is marked with a black dot) are determinants for this fold (Foster et al. Citation2000). (B) Sequence alignment of all hAQPs around TMD2, with the amino acids corresponding to Asn49 and Lys51 in hAQP1 highlighted. For hAQP4 M23 the corresponding amino acids are Met48 and Leu50. Nonpolar amino acids (hydrophobic) are marked in bold and polar and electrically charged (hydrophilic) are marked in bold and underlined. This Figure is reproduced in colour in Molecular Membrane Biology online where specific positions in are marked with a yellow dot.
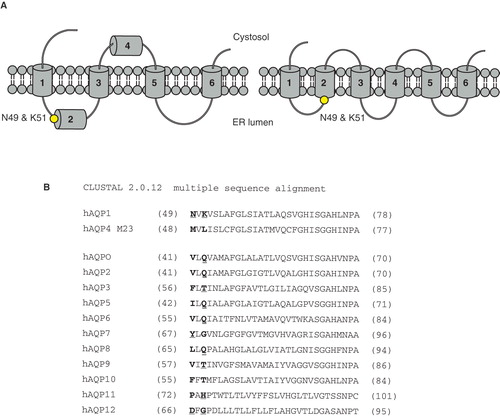
Table IV. Table showing the codon usage for P. pastoris (Pp), H. sapiens (Hs) and P. falciparum (Pf), respectively. The genetic code includes 64 possible ways of making a triplet, of these, three are stop codons in most organisms and are here marked with a star (*). The codon usage is given as fractions where 1 equals ‘always used' and the most commonly used codon is highlighted in bold. The GC content of the coded DNA is also given for each species. Gene frequencies are adapted from Codon Usage Database (Kazusa Citation2007) for P. pastoris, H. sapiens and P. falciparum where the species had the numbers 4922, 9606 and 36329 respectively.
Table V. Table showing the codon adaptation index (CAI) for aquaporins in their native host and P. pastori s, respectively, where the optimized genes are highlighted in bold. CAI calculations using CAIcal (Puigbo et al. Citation2008) and EMBOSS:cai (Bleasby Citation2001) were based on the Codon Usage Database (Kazusa Citation2007) for P. pastoris (Pp), H. sapiens (Hs) and P. falciparum (Pf) where the species had the numbers 4922, 9606 and 36329 respectively. CAI calculations from JCat (Grote et al. Citation2005) use its own codon tables and since it does not contain data for Pp or Pf, these columns have been omitted. For clarity, the values obtained from the calculators are separated by a dotted line. The GC content and the Nc value is also given. Nc represents the extent of the gene's codon bias; 20: strong bias, 61: no bias.
Table VI. Table summarizing the different results obtained when optimizing hAQP4 using JCat, GenScript or GeneArt. Total GC content is shown as well as the GC content of the first, second and third position in the codon. The number of bases changed is also presented as a percentage of the 969 nucleotides in the gene. Nc is a value representing the extent of the codon bias; 20: strong bias, 61: no bias.
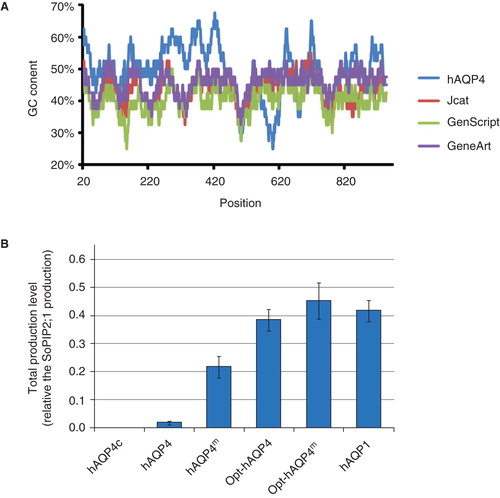
Figure 6. Various strategies to optimize the hAQP4 production in P. pastoris. (A) Plot showing the GC content in a 40 bp window centred at the indicated nucleotide position. Data were acquired using the EMBOSS:isochore (Rice Citation2011). (B) Bar chart showing the yield of four different hAQP4 versions. The genes have been transformed by electroporation except hAQP4c where chemical transformation has been used. Constructs having mutations causing an AQP1 like topology maturation have been indicated as hAQP4m. The prefix Opt symbolizes constructs where the gene has been codon optimized to better match the P. pastoris host system. This Figure is reproduced in colour in Molecular Membrane Biology online.