Figures & data
Figure 1. Microscopic images of cells plated with increasing cell density after one day growth. B16 cells were plated with 1.5–12 × 106 cells/10 cm plate in media containing 10% FCS. After one day in culture cells were fixed with paraformaldehyde, the nuclei were stained with 5 μM propidium-iodide and images were taken by CytoScout fluorescence microscope. Area coverage values are expressed as a % of total area. Data are presented as means ± SD (n = 3).
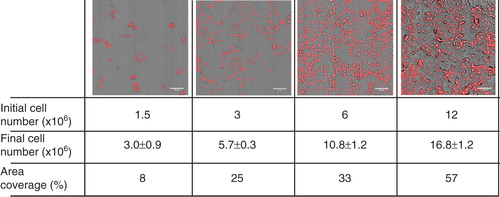
Figure 2. FA compositional changes (A) in FA groups and (B) in individual PUFAs of B16 cells upon varying initial cell number. Cells were plated with 1.5–12 × 106 cells/10 cm plate in 10 ml media containing 10% FCS. Lipids of the starter culture and those of derived from cells after one day growth were analysed by GC-MS. Data are expressed as weight% of total FAs and presented as means ± SD (n = 5).
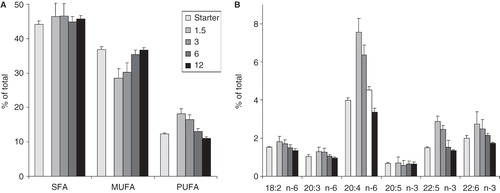
Figure 3. Quantitative changes in (A) FA groups and in (B) individual PUFAs of lipid classes in culture media. B16 cells were plated with 1.5–12 × 106 cells/10 cm plate in 10 ml media containing 10% FCS. Lipids of the growth media without cells (0) or with cells (1.5–12) were extracted after one day growth. Neutral lipid classes were separated on TLC and analysed by GC-MS. Data are expressed as μg FA/10 ml medium and presented as means ± SD (n = 5).
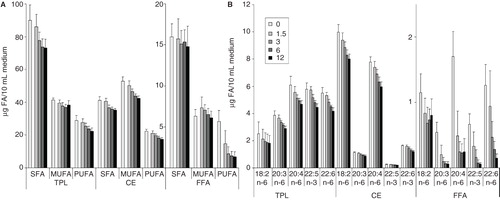
Figure 4. Comparison of FA fluxes in cells and in culture media. B16 cells were plated with 1.5–12 × 106 cells/10 cm plate in 10 ml media containing 10% FCS. After one day growth lipids of both cells and growth media were extracted. FA amount of the starter culture was subtracted from those of cells plated with different initial cell numbers to get the newly incorporated lipids (measured based on their FA content), while the FA amounts of growth media derived from cell-containing plates were subtracted from that of the growth medium itself to get the lipids taken up from the medium (measured based on their FA content). The differences between FAs newly incorporated into cells and taken up from the medium correspond to the de novo synthesized FAs. In insert: total FA amount of cells and media. Data are expressed as μg FA/10 cm plate (which is equivalent to 10 ml of culture medium).
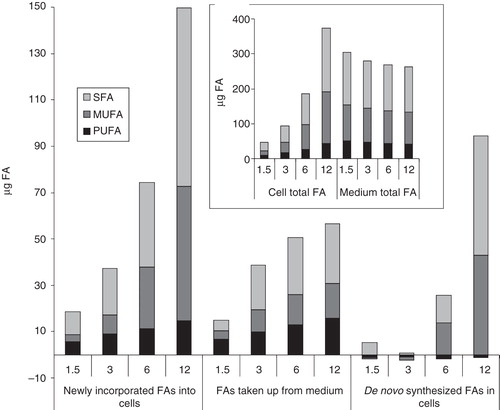
Figure 5. ESI-MS analysis of the B16 lipidome plated with different initial cell numbers. (A) Lipid class compositional changes. (B) and (C) Lipid molecular species that were elevated and lowered, respectively. Changes higher than 0.5% of total lipids are presented in descending order based on differences between the highest and the lowest initial cell number values. B16 cells were plated with 1.5–12 × 106 cells/10 cm plate in media containing 10% FCS. After one day growth lipids were extracted and analysed by ESI-MS. Data are expressed as mol% of total lipids and presented as means ± SD (n = 5).
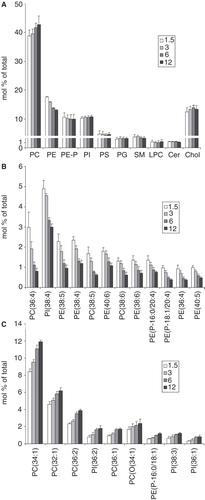
Figure 6. Changes in FA composition of B16 cells with serum concentration (A) in FA groups and (B) in individual PUFAs. Cells were plated with 3 × 10⁶ cells/10 cm plate in 10 ml media containing 0–20% FCS. Lipids were extracted and analysed by GC-MS after one day growth. Data are expressed as weight% of total FAs and presented as means ± SD (n = 3).
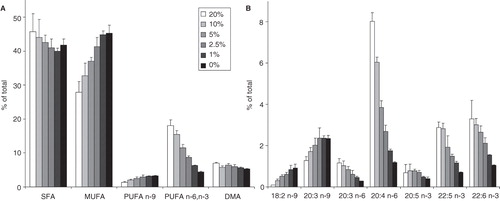
Figure 7. Fluorescence of fPEG-Chol-labelled membrane microdomains in B16 cells with increasing cell number. B16 cells were plated with 1.5–12 × 106 cells/10 cm plate in 10 ml media containing 10% FCS. After one day growth cells were labelled with 200 nM fPEG-Chol for 15 min and the fluorescence of membrane microdomains imaged by TIRF microscopy. Data are presented as means ± SD (n = 3).
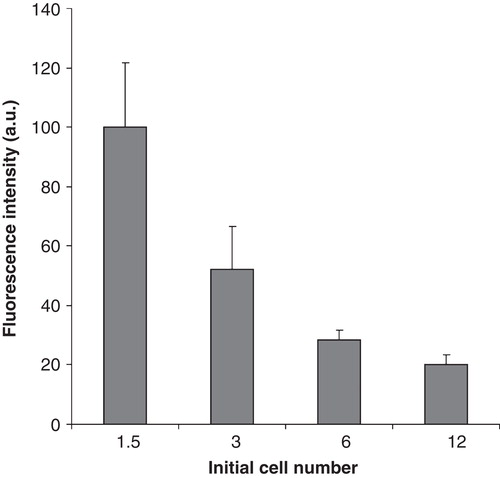
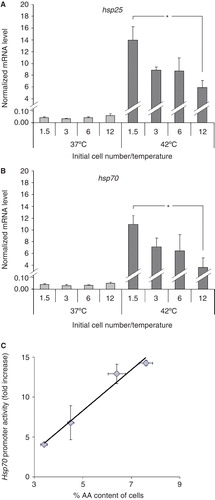
Figure 8. Modulation in the heat shock response with increasing plating density. Effects of the initial cell numbers on (A) hsp25 and (B) on hsp70 gene expression. B16 cells were plated with 1.5–12 × 106 cells/10 cm plate in 10 ml media containing 10% FCS. After one day growth cells were heat-shocked at 42°C or left untreated at 37°C for 1 h. Hsp expression was followed immediately after the treatments by quantitative real-time RT-PCR. The amounts of hsp25 and hsp70 mRNAs were determined and normalized to 103 β-actin. Data are expressed as means ± SEM. *, P < 0.05 as analysed by Student's paired t-test with the Bonferroni adjustment, n = 4. (C) Correlation between hsp70 promoter activity and cell's AA content. Cells were treated as above. Hsp70 promoter activity was followed after 16 h recovery period by flow cytometry. The mean fluorescence was normalized to the untreated controls. The AA content was measured as in . Data are expressed as means ± SEM, the solid line indicates the fitted linear regression, r = 0.98.