Figures & data
Figure 1. General architecture of NhaA Na+/H+ antiporter. (A) Ribbon representation of the crystal structure of NhaA (Hunte et al. Citation2005) viewed parallel to the membrane (broken line). The 12 TMs are labeled with Roman numerals. The cytoplasmic and periplasmic funnels are marked (black line). Cytoplasmic- and periplasmic-oriented TMs are denoted c and p, respectively. (B) Functional organization in NhaA (Padan Citation2008). A stick-and-ball representation of functionally important residues: in the putative active site (red or black) and the pH sensor (yellow or magenta). (C) The TM IV/XI assembly with the interrupted TMs and the putative active site (red circle). The Figures were generated by PyMOL.
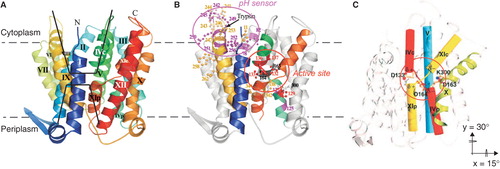
Figure 2. Identifying conformational changes of NhaA by site-directed Trp fluorescence. (A) The Figure shows the NhaA α-chain and the native Trp (green), the Trp replacements of Phe (orange), and the essential Asp163 and Asp164 in the active site (blue) in ball representation. (B, D, E, G, H). The steady-state fluorescence emission spectra of purified WT NhaA and its variants as indicated in DDM micells and the effect of pH or Li+. The proteins were affinity purified and incubated at protein concentration of 0.3–1 μM in a reaction mixture containing 20 mM 1,3-bis[tris(hydroxymethyl)methylamino]propaneat the indicated pH values, 150 mM choline chloride, 5 mM MgCl2 10% sucrose, and 0.015% DDM at pH 8.5 in the presence (red) or absence (black) of 10 mM LiCl or at pH 6 (green) without LiCl. The fluorescence emission spectra were measured with an excitation at 295 nm (B, D, E, H) or at 290 nm (G). For further details see (Kozachkov and Padan Citation2011). (C, F, I) The two different conformational changes, a pH-induced and a Li+-induced, are reflected by the fluorescence changes of single Trp/F136W and Trp/F339W, respectively. The reaction mixtures were as above and the fluorescence emission was measured with the time-dependent mode of the spectro-fluorimeter. The excitation was at 295 nm and the emission was at at the peak of each variant, 344, 335 and 338 nm for Trp-less NhaA, single Trp/F136W, and single Trp/F339W, respectively.
![Figure 2. Identifying conformational changes of NhaA by site-directed Trp fluorescence. (A) The Figure shows the NhaA α-chain and the native Trp (green), the Trp replacements of Phe (orange), and the essential Asp163 and Asp164 in the active site (blue) in ball representation. (B, D, E, G, H). The steady-state fluorescence emission spectra of purified WT NhaA and its variants as indicated in DDM micells and the effect of pH or Li+. The proteins were affinity purified and incubated at protein concentration of 0.3–1 μM in a reaction mixture containing 20 mM 1,3-bis[tris(hydroxymethyl)methylamino]propaneat the indicated pH values, 150 mM choline chloride, 5 mM MgCl2 10% sucrose, and 0.015% DDM at pH 8.5 in the presence (red) or absence (black) of 10 mM LiCl or at pH 6 (green) without LiCl. The fluorescence emission spectra were measured with an excitation at 295 nm (B, D, E, H) or at 290 nm (G). For further details see (Kozachkov and Padan Citation2011). (C, F, I) The two different conformational changes, a pH-induced and a Li+-induced, are reflected by the fluorescence changes of single Trp/F136W and Trp/F339W, respectively. The reaction mixtures were as above and the fluorescence emission was measured with the time-dependent mode of the spectro-fluorimeter. The excitation was at 295 nm and the emission was at at the peak of each variant, 344, 335 and 338 nm for Trp-less NhaA, single Trp/F136W, and single Trp/F339W, respectively.](/cms/asset/f3b29341-e393-49f3-8132-dd11a1a0c60b/imbc_a_693209_f0002_b.jpg)