Figures & data
Figure 1. Mevalonate pathway lipids and malondialdehyde in liver (A) and spleen (B) of LXRα, -β and double KO mice. The columns in the case of cholesterol and dolichol give both the free and the esterified forms. The values are means ± SD (n = 9). This Figure is reproduced in color in the online version of Molecular Membrane Biology.
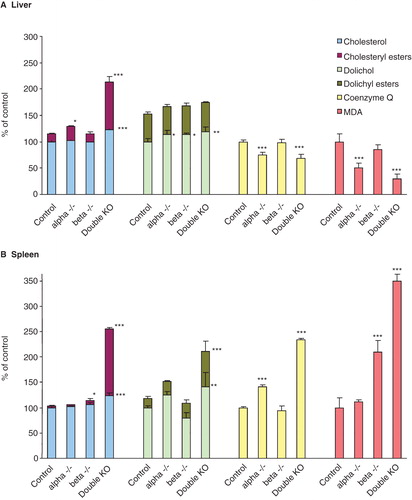
Figure 2. Mevalonate pathway lipids in thymus (A), kidney (B), heart (C) and lung (D) of LXRα, -β and double KO mice. The columns in the case of cholesterol and dolichol give both the free and the esterified forms. The values are means ± SD (n = 9). This Figure is reproduced in color in the online version of Molecular Membrane Biology.
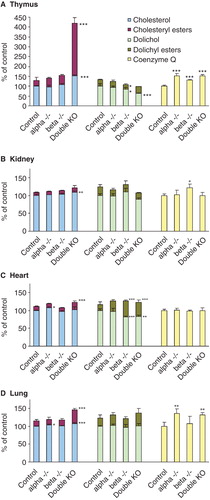
Figure 3. Effects of LXR agonist GW 3965 on the concentrations of mevalonate pathway lipids in liver (A) and spleen (B). In spleen the amount of cholesteryl esters are not given since these values are very low and at the sensitivity limit for detection. The values are means ± SD (n = 4). This Figure is reproduced in color in the online version of Molecular Membrane Biology.
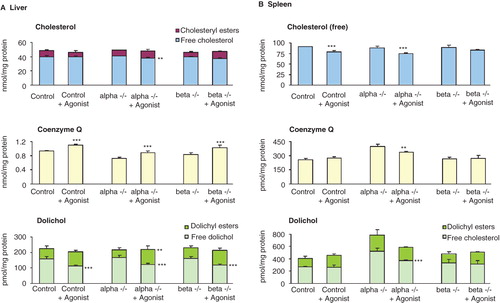
Table I. Subcellular distribution of mevalonate pathway lipids in liver.
Table II. Subcellular distribution of mevalonate pathway lipids in spleen.
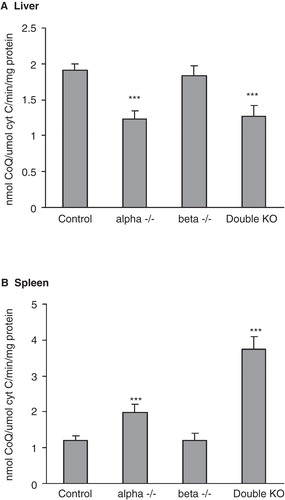
Figure 4. Coenzyme Q amount in mitochondria in relation to cytochrome c oxidase activity in liver (A) and spleen (B). Mitochondria were isolated by metrizamide gradient and their content of CoQ and cytochrome c oxidase activity was determined. The values are means ± SD (n = 4).