Figures & data
Table I. Parameters and variables for Equations (1) and (2). Dimensions of 3T3 cells were taken from Akhoondi et al. (Citation2011).
Figure 1. Infrared absorption spectra of 3T3 cells, acquired at 20°C in the absence and presence of DMSO and glycerol. The OH-stretching, H2O-libration and bending combination band, and the H2O scissoring band arising from water, the CH2-stretching bands mainly arising from membrane lipids, and the protein amide bands are indicated. Typical bands arising from glycerol and DMSO are visible in the 1200–900 cm-1 fingerprint region of the spectrum.
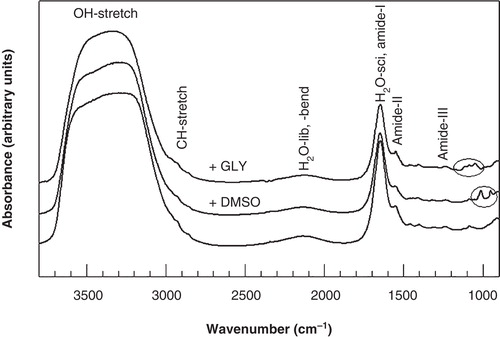
Figure 2. Membrane phase behavior of 3T3 cells during cooling in the absence of cryoprotective agents (open squares) as well as in presence of 5% DMSO (black squares) or glycerol (gray squares). Cell pellets were cooled from 20 to −40°C at cooling rate of 1°C min-1, and nucleated at either −4°C (A) or −10°C (B). The wavenumber position of the symmetric CH2 stretching vibration band is plotted as a function of the sample temperature.
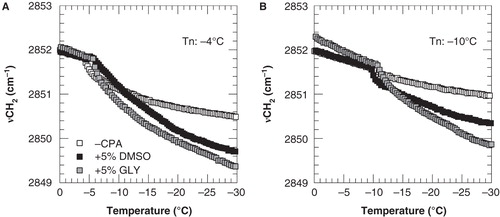
Figure 3. Cell volume response of 3T3 cells during cooling from 4°C down to −30°C at 1°C min-1, with ice nucleation at −5°C, in the absence of cryoprotective agents (A) and in presence of 5% DMSO (B) or glycerol (C). The cell volume response was determined as changes in cell size using cryomicroscopy (open squares) as well as derived from changes in the membrane lipid band (FTIR-νCH2; black squares) and water band (FTIR AνH2O; gray squares) determined using FTIR. Cell volumes were normalized towards the initial value prior to ice nucleation, and FTIR data were scaled towards the end volume as assessed using cryomicroscopy.
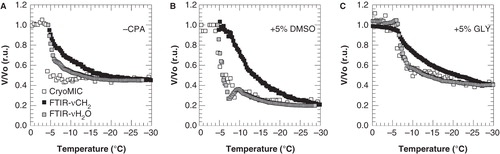
Table II. Subzero hydraulic membrane permeability parameters of 3T3 cells. Membrane permeability parameters were derived from cryomicroscopic as well as lipid band position (νCH2) and water band area (AνH2O) measurements.
Figure 4. Arrhenius plot of the membrane hydraulic permeability of 3T3 cells as a function of the nucleation temperature, as derived from cryomicroscopic studies (open squares) and membrane lipid band (FTIR-νCH2; black squares) and water band (FTIR- AνH2O; gray squares) analysis from FTIR studies. The dashed line represents extrapolated Coulter counter data from previous experiments performed at suprazero temperatures (Akhoondi et al. Citation2011).
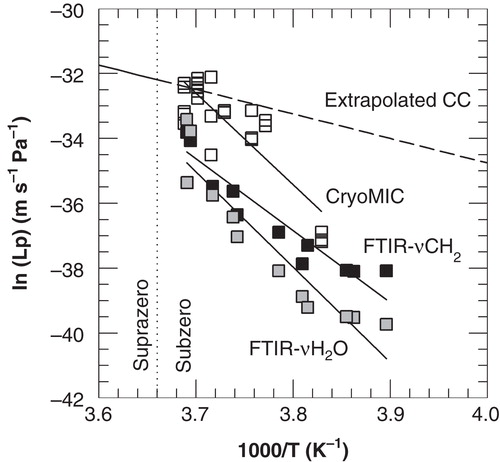
Table III. Subzero hydraulic membrane permeability parameters of 3T3 cells incubated in the presence of 5% DMSO or glycerol (GLY). Arrhenius plots derived from FTIR-νCH2 data were constructed. ELp-1 and Lpg-1 values were determined using linear regression analysis at high subzero temperatures, whereas ELp-2 and Lpg-2 were determined at low subzero temperature.
Figure 5. Arrhenius plots of the membrane hydraulic permeability of 3T3 cells as a function of the nucleation temperature in the presence of 5% DMSO (open squares) or glycerol (black squares), derived from membrane lipid band analysis from FTIR studies. Linear regression lines are indicated in the temperature ranges above and below −9 and −7°C for DMSO and glycerol, respectively.
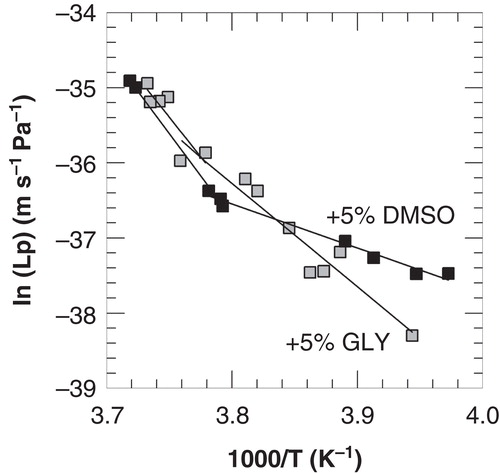
Figure 6. Membrane hydraulic permeability as a function of the temperature, as calculated using Equation (1) and the parameter listed in and , for cooling of 3T3 cells with 1°C min-1 in the absence of cryoprotective agents (open squares) as well as in presence of 5% DMSO (black squares) or glycerol (gray squares). To illustrate differences more clearly, different scales were used for the y-axis in panels A and B. Lp was calculated for above and below −9 and −7°C for DMSO and glycerol, respectively, using the different ELp and Lpg values as determined for these temperature ranges.
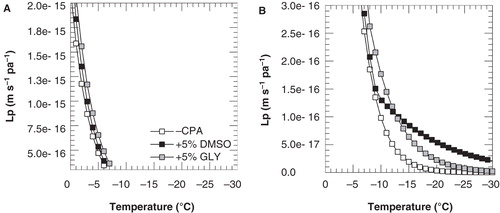
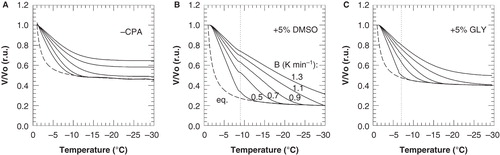
Figure 7. Cell volume response of 3T3 cells during cooling with different cooling rates in the absence of cryoprotective agents (A) as well as in presence of 5% DMSO (B) or glycerol (C), as calculated using Equation (1) and the parameter listed in and . Normalized cell volumes were calculated above and below −9 and −7°C for DMSO and glycerol, respectively, using the different ELp and Lpg values as determined for these temperature ranges. The dashed line illustrates the cell volume response under equilibrium conditions, as calculated using Equation (3).