Figures & data
Figure 1. Total content (A) and the level of monounsaturated (MUFA) (B) and saturated (SFA) (C) species of free fatty acids (FFA), diacylglycerols (DAGs), triacylglycerols (TAG) and phospholipids (PL) in C2C12 myotubes treated with albumin (BSA – control cells), palmitate (16:0), stearate (18:0) or oleate (18:1). *p < 0.05 vs. BSA-treated cells; # p < 0.05 vs. 16:0-treated cells; & p < 0.05 vs. 18:0-treated cells. The results presented are the average ± SD from three independent experiments.
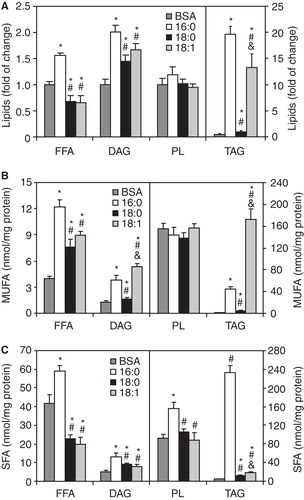
Figure 2. Individual diacylglycerol (DAG) molecular species (A) and protein level of stearoyl-CoA desaturase 1 (SCD1) (B) in C2C12 myotubes treated with palmitate (16:0), stearate (18:0) or oleate (18:1). *p < 0.05 vs. BSA-treated cells; # p < 0.05 vs. 16:0-treated cells; & p < 0.05 vs. 18:0-treated cells. The results presented are the average ± SD from three independent experiments.
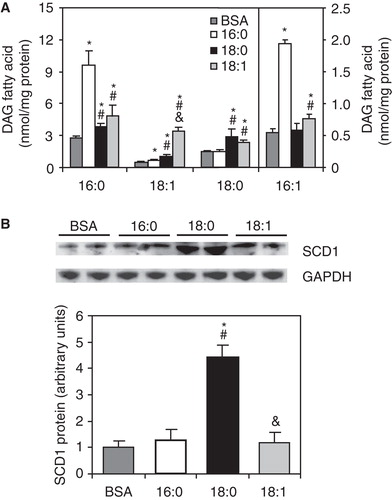
Figure 3. Membrane (mem.) and cytosolic (cyt.) content and cell distribution of PKC-theta (A) and fold of insulin-stimulated Akt phosphorylation change from baseline state (B) in C2C12 myotubes treated with palmitate (16:0), stearate (18:0) or oleate (18:1). *p < 0.05 vs. BSA-treated cells; # p < 0.05 vs. 16:0-treated cells; & p < 0.05 vs. 18:0-treated cells. The results presented are the average ± SD from three independent experiments.
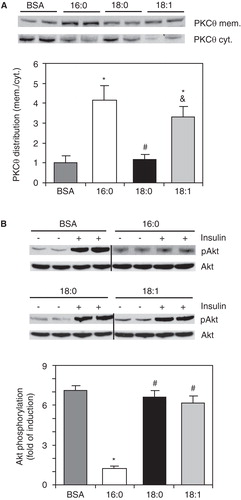
Figure 4. Total content of muscle diacylglycerol (DAG) (A), individual DAG molecular species in red (B) and white (C) sections of gastrocnemius muscle, and muscle stearoyl-CoA desaturase (SCD1) protein levels (D) in rats fed chow, high-fat (HF), high-tristearate (TS) or high-trioleate (TO) diets. *p < 0.05 vs. chow-fed rats; # p < 0.05 vs. HF-fed rats; & p < 0.05 vs. TS-fed rats; n = 8.
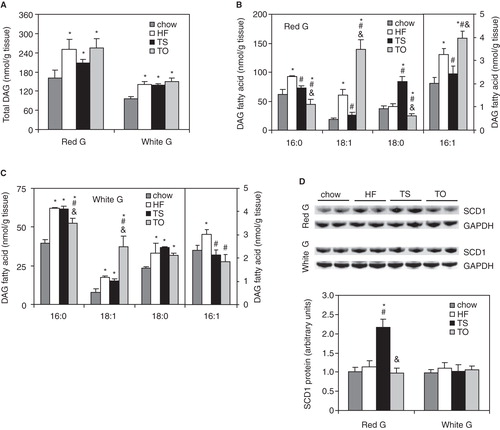
Figure 5. PKC-theta membrane (mem.) and cytosolic (cyt.) content and distribution (A), phosphorylation of Akt (B) and GLUT4 membrane localization (C) in red and white sections of gastrocnemius muscle of rats fed chow, high-fat (HF), high-tristearin (TS) or high-triolein (TO) diets. *p < 0.05 vs. chow-fed rats; # p < 0.05 vs. HF-fed rats; & p < 0.05 vs. TS-fed rats; n = 8.
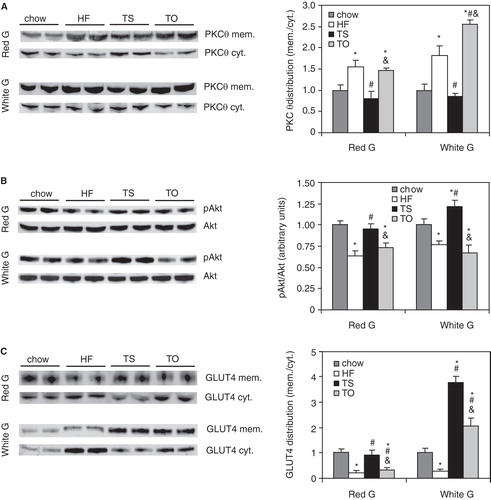
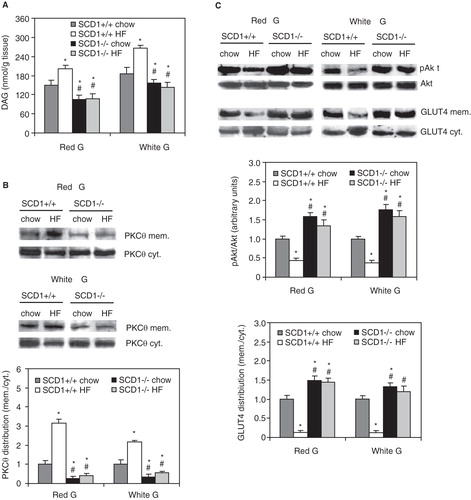
Figure 6. Total diacylglycerol (DAG) level (A), PKC-theta membrane (mem.) and cytosolic (cyt.) content and distribution (B) and phosphorylation of Akt and GLUT4 membrane localization (C) in red and white sections of gastrocnemius muscle of wild-type (SCD1+/+) and SCD1-deficient (SCD1-/-) mice fed chow or a high-fat (HF) diet. *p < 0.05 vs. SCD1+/+ chow-fed mice; # p < 0.05 vs. SCD1+/+ HF-fed mice; n = 6.