Figures & data
Figure 1. Chemical structures of the nine inositol stereoisomers.
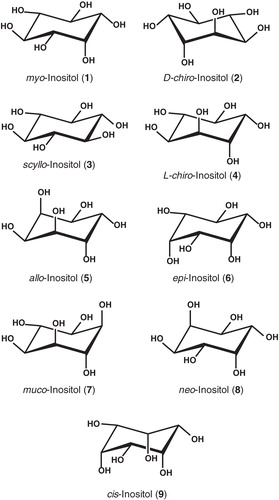
Figure 2. Amplified expression of the His-tagged proteins in E. coli inner membrane preparations. Coomassie-stained SDS-PAGE (A) and Western blot (B) analysis of E. coli inner membrane preparations from BL21(DE3) cells containing the empty plasmid pTTQ18 (negative control, (C) or the pTTQ18 plasmid with the gene inserts for expressing IolT(His6), IolF(His6) or YfiG(His6) that were induced with 0.5 mM IPTG. The SDS-PAGE lanes were loaded with 15 μg of total protein and the blot came from a gel that was loaded with 5 μg of total protein per lane. MW, molecular weight markers.
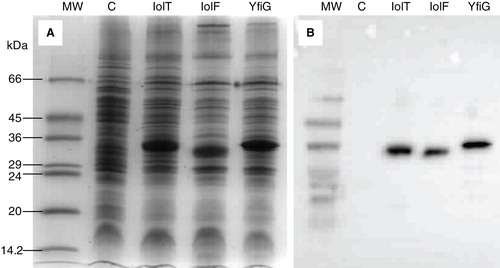
Figure 3. Time-course of 3H-myo-inositol uptake into energized E. coli cells. The plots show the measured uptake of [2-3H]-myo-inositol into BL21(DE3) cells containing the empty plasmid pTTQ18 (control, ▴) or the pTTQ18 plasmid with the gene inserts for expressing IolT(His6), IolF(His6) or YfiG(His6) from cultures that were uninduced (▪) or induced (•) with 0.5 mM IPTG for 1 hour, washed and suspended to an A680 of 2.0, energized in the presence of 20 mM glycerol for 3 minutes, then incubated with [2-3H]-myo-inositol (50 μM) for a range of time points from 15 seconds to 10 minutes. The data points are the average of triplicate measurements.
![Figure 3. Time-course of 3H-myo-inositol uptake into energized E. coli cells. The plots show the measured uptake of [2-3H]-myo-inositol into BL21(DE3) cells containing the empty plasmid pTTQ18 (control, ▴) or the pTTQ18 plasmid with the gene inserts for expressing IolT(His6), IolF(His6) or YfiG(His6) from cultures that were uninduced (▪) or induced (•) with 0.5 mM IPTG for 1 hour, washed and suspended to an A680 of 2.0, energized in the presence of 20 mM glycerol for 3 minutes, then incubated with [2-3H]-myo-inositol (50 μM) for a range of time points from 15 seconds to 10 minutes. The data points are the average of triplicate measurements.](/cms/asset/17f199f5-5dca-4f08-a544-4954c6913baf/imbc_a_729093_f0003_b.jpg)
Table I. Steady-state kinetic parameters for initial-rate measurements of 3H-myo-inositol transport. Values for the apparent affinity of initial-rate transport (K m app) and its maximum velocity (V max ) were calculated using Graph Pad Prism 5 software for least-squares fits of the data to the Michaelis-Menten equation for the concentration-dependent uptake of myo-inositol into energized E. coli whole cells measured after 15 seconds ().
Figure 4. Concentration-dependence of initial-rate 3H-myo-inositol uptake into energized E. coli cells. Michaelis-Menten plots for the uptake of [2-3H]-myo-inositol after 15 seconds into BL21(DE3) cells containing the empty plasmid pTTQ18 (control, ▴) or the pTTQ18 plasmid with the gene inserts for expressing IolT(His6), IolF(His6) or YfiG(His6) from cultures that were uninduced (▪) or induced (•) with 0.5 mM IPTG for 1 hour, washed and suspended to an A680 of 2.0, energized in the presence of 20 mM glycerol for 3 minutes, then incubated for 15 seconds with [2-3H]-myo-inositol at a range of concentrations (0.025, 0.05, 0.1, 0.2, 0.4, 0.8 and 1.6 mM). The data points are the average of triplicate measurements.
![Figure 4. Concentration-dependence of initial-rate 3H-myo-inositol uptake into energized E. coli cells. Michaelis-Menten plots for the uptake of [2-3H]-myo-inositol after 15 seconds into BL21(DE3) cells containing the empty plasmid pTTQ18 (control, ▴) or the pTTQ18 plasmid with the gene inserts for expressing IolT(His6), IolF(His6) or YfiG(His6) from cultures that were uninduced (▪) or induced (•) with 0.5 mM IPTG for 1 hour, washed and suspended to an A680 of 2.0, energized in the presence of 20 mM glycerol for 3 minutes, then incubated for 15 seconds with [2-3H]-myo-inositol at a range of concentrations (0.025, 0.05, 0.1, 0.2, 0.4, 0.8 and 1.6 mM). The data points are the average of triplicate measurements.](/cms/asset/aef1f7c2-ec2e-49f5-9241-828dbf2de74d/imbc_a_729093_f0004_b.jpg)
Table II. Specificities of ligand recognition by IolT, IolF and YfiG. Uptakes of [2-3H]-myo-inositol (50 μM) were measured after 2 minutes in energized E. coli cells containing the plasmid with gene inserts for expressing IolT(His6), IolF(His6) or YfiG(His6) in the absence or presence of unlabelled competing compounds at a concentration of 500 μM incubated with the cells for 3 minutes before adding the 3H-myo-inositol. The uptake from cells with no competing compound present (bottom of table) was taken as the 100% value. These data are derived from an average of triplicate measurements with standard deviations of at most 5%.
Figure 5. Solubilization and purification of the proteins from E. coli inner membranes. (A) A full SDS-PAGE analysis of the solubilization and purification procedure for IolF(His6) is shown, where the lanes contain: (1) molecular weight markers; (2) IolF(His6) inner membranes; (3) unsolubilized fraction (pellet); (4) solubilized fraction (supernatant); (5) unbound fraction (from column); (6) column wash; (7) eluted and concentrated protein (5 μg); (8) eluted and concentrated protein (10 μg). Coomassie-stained SDS-PAGE (B) and Western blot (C) analyses of IolT(His6), IolF(His6) and YfiG(His6) proteins that had been solubilized from inner membrane preparations, purified on a Ni-affinity column and reconstituted into DDM detergent micelles. The SDS-PAGE lanes were loaded with 10 μg of total protein and the blot came from a gel that was loaded with 5 μg of protein per lane. MW, molecular weight markers.
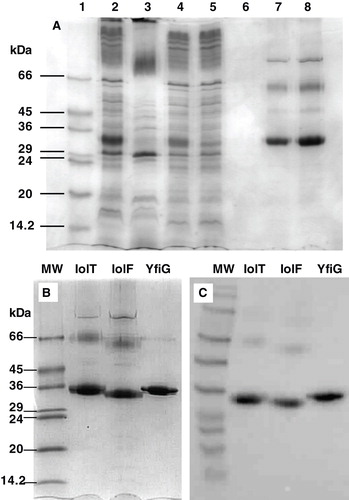
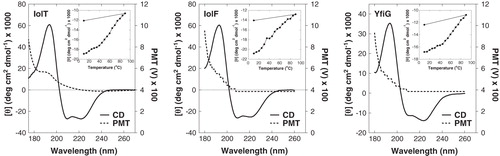
Figure 6. Analysis of secondary structure in the purified proteins. Synchrotron radiation circular dichroism (SRCD) spectra at 20°C in the far-UV region are shown for the purified IolT(His6), IolF(His6) and YfiG(His6) proteins at a concentration of 20 μM in a buffer containing 0.05% DDM and 10 mM potassium phosphate (pH 7.6) using a 0.2-mm path length cell and acquiring spectra with an integration time of sec, slit 0.5 mm equivalent to 1.2 nm bandwidth, scan speed of 34 nm/min. The spectra are buffer-subtracted and are the average of 4 scans. The plots show the CD spectrum (CD) and the photomultiplier tube (PMT) voltage values. Inset are thermal stability profiles at a wavelength of 222 nm from CD spectra recorded over a range of temperatures (10–90°C and then back to 10°C) for each of the proteins.