Figures & data
Figure 1. Amplified expression of the E. coli sugar transport protein GalP and chemical structures of its substrate D-glucose. (A) Coomassie-stained SDS-PAGE separation of proteins in an E. coli inner membrane preparation with amplified expression of GalP (arrow). The numbers on the left-hand side represent the sizes of the molecular weight markers in kDa. (B) Structure of the GalP substrate D-glucose drawn in its α and β configurations.
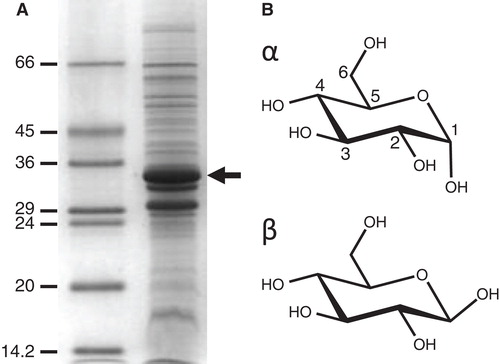
Figure 2. 13C NMR spectra (obtained with 4 kHz MAS) of inner membrane preparations from E. coli with amplified expression of GalP (∼ 1 mM) in H2O with 10 mM D-[13C6]glucose. The sample temperature was −15°C and each spectrum is the result of accumulating 20480 transients. (A–C) 13C CP-MAS NMR spectra obtained before (A) and after (B) addition of forskolin in ethanol (final concentrations 2 mM and 2%, respectively) and a difference spectrum (C) obtained by subtracting B from A. (D–E) Direct excitation 13C MAS spectra of the same samples obtained before (D) and after (E) addition of forskolin and a difference spectrum (F) obtained by subtracting E from D. The negative peaks in F are from the ethanol solvent. Addition of ethanol alone to the membranes had no effect upon either the CP-MAS or direct excitation spectra. Note that disappearance of signals for carbonyl carbons in the direct excitation spectra D and E is the result of their fast relaxation rate; this does not affect the conclusions drawn from the comparison of spectra D and E.
![Figure 2. 13C NMR spectra (obtained with 4 kHz MAS) of inner membrane preparations from E. coli with amplified expression of GalP (∼ 1 mM) in H2O with 10 mM D-[13C6]glucose. The sample temperature was −15°C and each spectrum is the result of accumulating 20480 transients. (A–C) 13C CP-MAS NMR spectra obtained before (A) and after (B) addition of forskolin in ethanol (final concentrations 2 mM and 2%, respectively) and a difference spectrum (C) obtained by subtracting B from A. (D–E) Direct excitation 13C MAS spectra of the same samples obtained before (D) and after (E) addition of forskolin and a difference spectrum (F) obtained by subtracting E from D. The negative peaks in F are from the ethanol solvent. Addition of ethanol alone to the membranes had no effect upon either the CP-MAS or direct excitation spectra. Note that disappearance of signals for carbonyl carbons in the direct excitation spectra D and E is the result of their fast relaxation rate; this does not affect the conclusions drawn from the comparison of spectra D and E.](/cms/asset/e8bc61d4-41d7-418f-8801-5a7f8955150b/imbc_a_743193_f0002_b.jpg)
Figure 3. Experiments to assign the 13C NMR spectrum of D-[13C6]glucose in inner membrane preparations from E. coli with amplified expression of GalP. (A) Top: A simulated 1D 13C NMR spectrum of D-glucose calculated from the measured chemical shift values for D-[13C6]glucose in water but using line widths comparable to those for D-[13C6]glucose in the membrane preparations. Bottom: An experimental 1D CP-MAS NMR spectrum of D-[13C6]glucose in the GalP membranes obtained with 4 kHz MAS and a contact time of 1 ms. Comparison of the simulated and experimental spectra with similar line widths highlights the differences in chemical shifts for glucose in the two environments. (B) Region of a 2D DARR spectrum of D-[13C6]glucose in the GalP membranes obtained with 8 kHz MAS, showing the cross peaks assigned to glucose. The measured chemical shifts were used to peak fit the 1D spectrum in (B), by varying only the peak widths and areas (as shown in the overlaid deconvolution in B). The experimental temperature was −15°C.
![Figure 3. Experiments to assign the 13C NMR spectrum of D-[13C6]glucose in inner membrane preparations from E. coli with amplified expression of GalP. (A) Top: A simulated 1D 13C NMR spectrum of D-glucose calculated from the measured chemical shift values for D-[13C6]glucose in water but using line widths comparable to those for D-[13C6]glucose in the membrane preparations. Bottom: An experimental 1D CP-MAS NMR spectrum of D-[13C6]glucose in the GalP membranes obtained with 4 kHz MAS and a contact time of 1 ms. Comparison of the simulated and experimental spectra with similar line widths highlights the differences in chemical shifts for glucose in the two environments. (B) Region of a 2D DARR spectrum of D-[13C6]glucose in the GalP membranes obtained with 8 kHz MAS, showing the cross peaks assigned to glucose. The measured chemical shifts were used to peak fit the 1D spectrum in (B), by varying only the peak widths and areas (as shown in the overlaid deconvolution in B). The experimental temperature was −15°C.](/cms/asset/4f66fa9f-3d64-4f13-a52c-a2bf1e0336f4/imbc_a_743193_f0003_b.jpg)
Table I. 13C chemical shifts for D-[13C6]glucose.
Figure 4. Investigation of using NMR samples in D2O and with a 2H,13C-labelled ligand for solid-state NMR measurements on membrane proteins with low affinity ligands under frozen conditions. A shows the possible sources of 1H-13C CP interactions that can contribute to the 13C signal for a membrane protein sample in H2O with a 13C-labelled ligand under frozen conditions (< −10°C). The grey circle represents a 13C-labelled ligand that binds to a membrane protein expressed in native membranes or that is purified and reconstituted in lipid membranes. The 1H-13C CP interactions are labelled as follows: (i) 1H in the ligand backbone; (ii) 1H in ligand hydroxyl groups (or other exchangeable groups); (iii) 1H in water molecules that are frozen/immobilized (non-specific); (iv) protein non-exchangeable 1H (specific binding); (v) protein exchangeable 1H (specific binding); (vi) membrane non-exchangeable 1H (non-specific); (vii) membrane exchangeable 1H (non-specific). B shows 1H-13C CP-MAS NMR spectra for E. coli inner membranes with amplified expression of GalP containing D-[13C6]glucose at a concentration of 10 mM prepared in H2O with the sample at a temperature of −15°C and acquired using CP contact times of 1 ms (upper spectrum) and 8 ms (lower spectrum). C shows the possible sources of 1H-13C CP interactions that can contribute to the 13C signal for a membrane protein sample in D2O with a 2H,13C-labelled ligand under frozen conditions (< −10°C), where the 1H-13C interactions are labelled as described above. D shows 1H-13C CP-MAS NMR spectra for E. coli inner membranes with amplified expression of GalP containing D-[2H7,13C6]glucose at a concentration of 10 mM prepared in D2O with the sample at a temperature of −15°C and acquired using CP contact times of 1 ms (upper spectrum) and 8 ms (lower spectrum). In B and D, the hatched box highlights the region where the 13C signals for D-glucose appear in the spectrum.
![Figure 4. Investigation of using NMR samples in D2O and with a 2H,13C-labelled ligand for solid-state NMR measurements on membrane proteins with low affinity ligands under frozen conditions. A shows the possible sources of 1H-13C CP interactions that can contribute to the 13C signal for a membrane protein sample in H2O with a 13C-labelled ligand under frozen conditions (< −10°C). The grey circle represents a 13C-labelled ligand that binds to a membrane protein expressed in native membranes or that is purified and reconstituted in lipid membranes. The 1H-13C CP interactions are labelled as follows: (i) 1H in the ligand backbone; (ii) 1H in ligand hydroxyl groups (or other exchangeable groups); (iii) 1H in water molecules that are frozen/immobilized (non-specific); (iv) protein non-exchangeable 1H (specific binding); (v) protein exchangeable 1H (specific binding); (vi) membrane non-exchangeable 1H (non-specific); (vii) membrane exchangeable 1H (non-specific). B shows 1H-13C CP-MAS NMR spectra for E. coli inner membranes with amplified expression of GalP containing D-[13C6]glucose at a concentration of 10 mM prepared in H2O with the sample at a temperature of −15°C and acquired using CP contact times of 1 ms (upper spectrum) and 8 ms (lower spectrum). C shows the possible sources of 1H-13C CP interactions that can contribute to the 13C signal for a membrane protein sample in D2O with a 2H,13C-labelled ligand under frozen conditions (< −10°C), where the 1H-13C interactions are labelled as described above. D shows 1H-13C CP-MAS NMR spectra for E. coli inner membranes with amplified expression of GalP containing D-[2H7,13C6]glucose at a concentration of 10 mM prepared in D2O with the sample at a temperature of −15°C and acquired using CP contact times of 1 ms (upper spectrum) and 8 ms (lower spectrum). In B and D, the hatched box highlights the region where the 13C signals for D-glucose appear in the spectrum.](/cms/asset/4a964639-4636-4014-b10e-2e8e97a4c910/imbc_a_743193_f0004_b.jpg)
Figure 5. Cross-polarization build-up curves for C1 and C2 in D-glucose from samples of GalP membranes in D2O. 13C signal intensities normalized to the highest value are shown for C1 and C2 in the α and β anomers of D-glucose (based on chemical shifts from the DARR spectrum in ) from 1H-13C CP-MAS spectra recorded at a range of contact times on samples of GalP membranes in D2O with D-[13C6]glucose (A) and with D-[2H7, 13C6]glucose (B) under frozen conditions. Both samples contained GalP at a concentration of ∼ 1 mM and the labelled D-glucose at a concentration of 10 mM. A sample temperature of −15°C and MAS at 4 kHz was used. Spectra were recorded over 20480 scans at each contact time.
![Figure 5. Cross-polarization build-up curves for C1 and C2 in D-glucose from samples of GalP membranes in D2O. 13C signal intensities normalized to the highest value are shown for C1 and C2 in the α and β anomers of D-glucose (based on chemical shifts from the DARR spectrum in Figure 3B) from 1H-13C CP-MAS spectra recorded at a range of contact times on samples of GalP membranes in D2O with D-[13C6]glucose (A) and with D-[2H7, 13C6]glucose (B) under frozen conditions. Both samples contained GalP at a concentration of ∼ 1 mM and the labelled D-glucose at a concentration of 10 mM. A sample temperature of −15°C and MAS at 4 kHz was used. Spectra were recorded over 20480 scans at each contact time.](/cms/asset/362e190f-a516-41ec-96e0-e17526d23fb0/imbc_a_743193_f0005_b.jpg)