Figures & data
Table I. Global quality scores (z-scores) for energy minimized monomers of the template and homology model calculated with different programs. The values were obtained by the Protein Structure Validation Software Suite (http://www.nesg.org).
Table II. Properties obtained from the Protein Structure Validation Suite (http://www.nesg.org) for the template (GlpF) and the homology model (hAQP9). Both structures were relaxed in the Amber ff99SB-ILDN force field. Here the absolute values instead of the z-scores () are given. A lower MolProbity score indicates a better model.
Figure 1. Homology model of human AQP9. The pore residues of the template (A) and the homology model (B). Configuration of the single water file permeating the pore taken from an equilibrated MD simulation after 50 ns of unrestrained relaxation (C). This Figure is reproduced in color in Molecular Membrane Biology online.
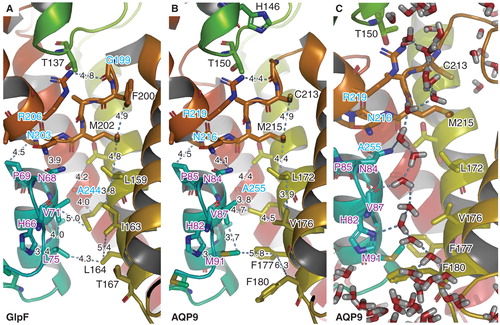
Figure 2. Root mean square deviation (RMSD) traces of two independent MD simulations of hAQP9 indicate structural stability of the model in the simulated time window. This Figure is reproduced in color in Molecular Membrane Biology online.
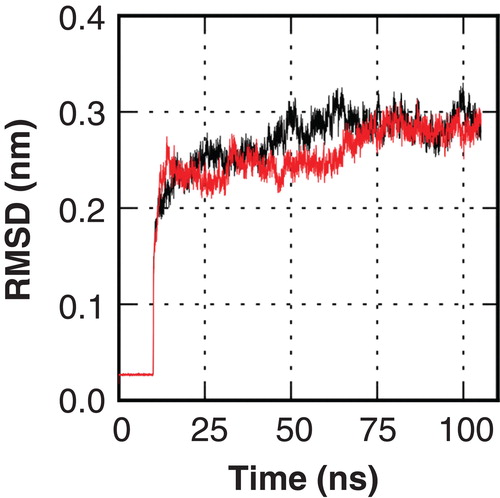
Figure 3. Computed pf values from molecular dynamics (MD) simulations with the hAQP9 homology model in complex with mAQP9 inhibitors. Compounds were ranked according to their inhibitory effect of mAQP9. The values represent the mean from four individual subunits of the tetramer and the error bars indicate the standard deviation. As a reference, the pf computed from two separate MD simulations without inhibitors is depicted with a dashed line (average) and a gray area (standard deviation). Compounds binding to the extracellular site suppressed water permeability more (average pf = 0.96 +/− 0.55 × 10⁻¹⁴ cm3/s) than binding to the intracellular site (average pf = 1.5 +/− 0.85 × 10⁻¹⁴ cm3/s). However, the computed pf values of the individual molecules did not correlate with measured activities on mAQP9 (data not shown).
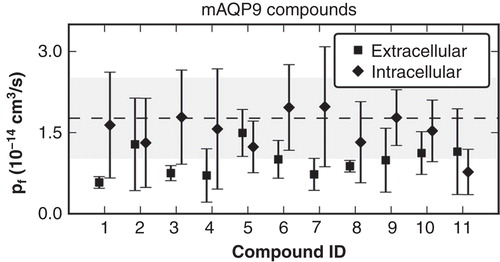
Table III. Conservative amino acid changes introduced into hAQP9 by site-directed mutagenesis.
Figure 4. Effects of hAQP9 single amino acid exchanges on inhibitor potency in CHO-hAQP9 cell shrinking assays. Induction of hAQP9 was titrated with tetracycline to achieve similar baseline cell water permeabilities in all cell lines, except for CHO-hAQP9 F180V, where this was not possible. The lowest x-axis values in each dose-response curve are 0, and have been altered for presentation on a log-transformed graph. Phloretin, CD05595, RF03176 and HTS13772 effects were significantly altered by intracellular amino acid exchanges, while HTS13286 was not significantly affected by any mutation introduced into hAQP9. CHO-hAQP9 F180V was excluded from statistical analysis. Two-way ANOVA and Bonferroni post tests suggested significant differences at P < 0.001 (n = 5) as indicated by asterisks. Black asterisk (1) indicates significant effect of all three extracellular amino acid exchanges. Tanimoto compound similarity index compared to RF03176: HTS13772 (0.590308); CD05595 (0.231939); Phloretin (0.227891); HTS13286 (0.219626); HTS03850 (0.12743). This Figure is reproduced in color in Molecular Membrane Biology online.
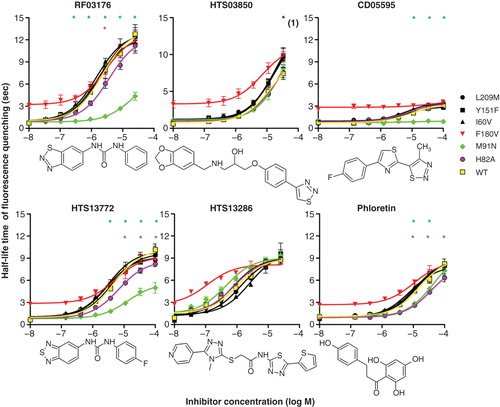
Figure 5. Benchmark results. ROC-curves for Vina using rankings according to multiple receptor configurations (A) and for LeadIT using two different conformations of the WT and single structures of the mutants H82A and M91N (B). The steps indicate the ranking of the 12 active compounds in the test library. The red dashed lines correspond to a perfectly ranked list of compounds where all active compounds have lower scores than inactive compounds and therefore are perfectly separated from inactives. Different receptor conformations lead to different scores and therefore to different rankings. The dark grey area around the black dashed line indicates where random distributions of compounds are expected. Ranking according to LeadIT led to a significant enrichment separation of active compounds. This Figure is reproduced in color in Molecular Membrane Biology online.
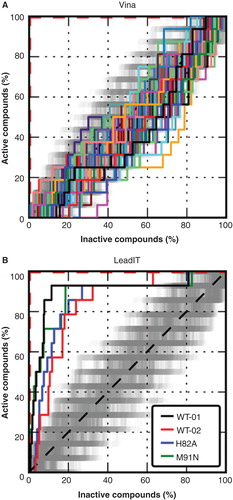
Table IV. The area under the receiver-operator-characteristic (ROC)-curves (AUC) for the individual receptors using LeadIT.
Table V. Number of active compounds in the first percent of a ranked list (N) and the corresponding 95% quantiles of randomly distributed lists. For Vina only the maximal values are shown. For the wild-type values for both configurations the crystal structure (WT) and the MD-snapshot (WT-MD) are shown. Values larger than the 95-quantiles indicate significant enrichments.
Figure 6. Effects of hAQP9 single amino acid exchanges on CHO-hAQP9 cell water permeability. Induction of hAQP9 was titrated with tetracycline to achieve similar baseline cell water permeabilities in all cell lines. Intracellular amino acid exchanges resulted in enhanced or reduced inhibitor potency for five out of six tested substances, corresponding to the six substances with the lowest apparent IC50 (see Supplementary spreadsheet 2, available online). Of these, compound ID1 was a very moderate inhibitor of CHO-hAQP9 cell water permeability. Two-way ANOVA and Bonferroni post-tests suggested significant differences from hAQP9 at P < 0.001 (n = 3) as indicated by asterisks. Black asterisks refer to: (a) hAQP9 L209M and hAQP9 I60V, (b) hAQP9 L209M, (c) hAQP9 I60V. Tanimoto compound similarity index compared to ID2: ID1 (0.251773); ID3 (0.336303); ID4 (0.258467); ID5 (0.455446); ID6 (0.45182). This Figure is reproduced in color in Molecular Membrane Biology online.
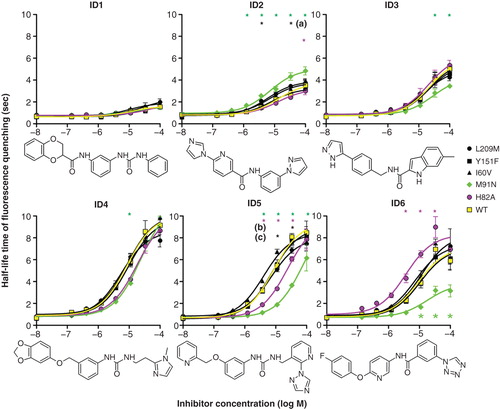
Figure 7. Calculated pf values from MD simulations using ligand poses generated with molecular docking as initial configurations for the substances.
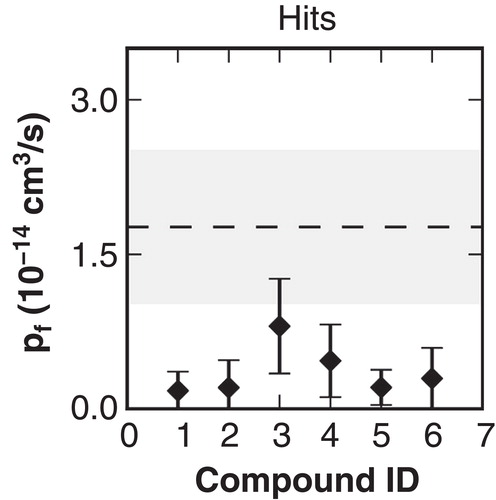
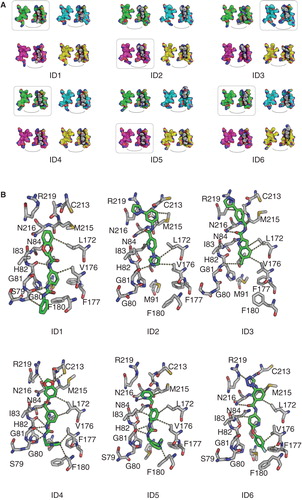
Figure 8. Final positions of the top six tested substances. (A) Substances bound to all four monomers at the intracellular side of the hAQP9 homology model. The carbon atoms of the four subunits are colored differently: (1: green, 2: cyan, 3: magenta, 4: light yellow). The coloring corresponds to the coloring of the RMSD traces in Supplementary Figure S4, available online). The remaining atoms are colored according to the conventional coloring scheme for chemical elements as used in Pymol. (B) Poses highlighted by frames in (A) in atomic detail. Polar and non-polar interaction sites between receptor (grey) and ligands (green) are represented by the dashed lines. This Figure is reproduced in color in Molecular Membrane Biology online.