Figures & data
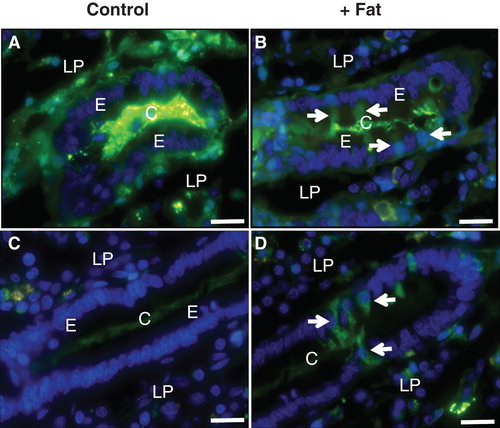
Figure 1. Absorption and deposition of fat visualized by staining with Nile red after culture for 1 h in the absence (Control) or presence (+ Fat) of a physiological mixture of digested fat. (A) In a section of villus from a control explant no or few fat droplets were visible in enterocytes (E) or the lamina propria (LP). (B) After fat absorption numerous punctae representing fat droplets or nascent chylomicrons were seen in the apical cytoplasm of enterocytes. Some were also seen in the basal part of the cells and in the underlying lamina propria, indicative of enterocytic export of chylomicrons. (C) & (D) In the crypts (C), distinct fat droplets (marked by arrows) were seen lining the basal membrane of the enterocytes regardless whether fat absorption had taken place or not. Bars, 20 μm. This Figure is reproduced in color in Molecular Membrane Biology online.
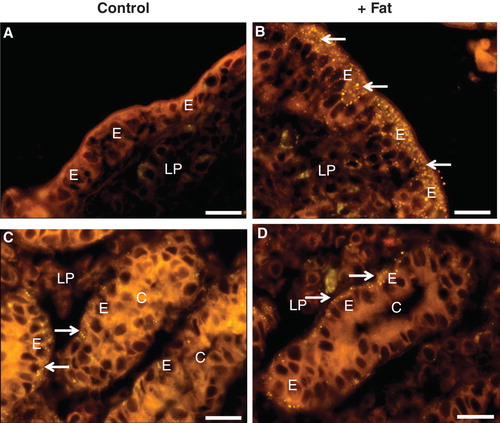
Figure 2. Permeabilization of enterocytes by a fat mixture after culture for 1 h in the presence of LY. (A) In the villus region of a control explant LY was mainly seen along the basal lamina and in the lamina propria. Enterocytes generally appeared LY-negative, but at higher magnification (insert) small punctae, indicative of endocytosis, were visible. In addition, LY was seen along the lateral sides of the enterocytes (marked by arrows), indicating a paracellular passage through the epithelium. (B) Fat absorption did not change the general LY labeling of the villus, but occasionally permeabilized enterocytes were seen (arrow). (C) & (E) In the crypts of control explants LY was mainly seen in the lumen and along the basal lamina. (D) & (F) After fat absorption several enterocytes in the crypts accumulated LY in the cytosol and nucleus (some marked by arrows), whereas their neighboring cells were seemingly unaffected. Bars, 20 μm. This Figure is reproduced in color in Molecular Membrane Biology online.
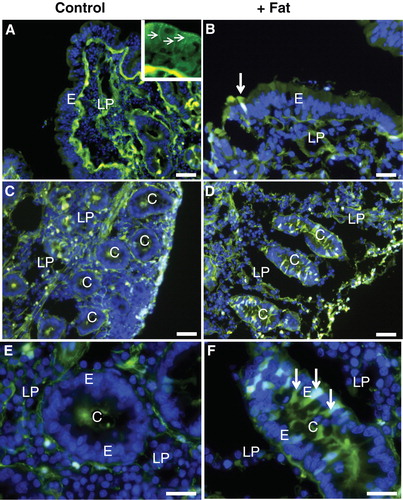
Figure 3. (A) & (B) Mucosal explants cultured for 1 h with LY in the absence or presence of bile. LY-positive cells were only rarely observed in the control (A), but frequently seen in the crypts after exposure to bile (some marked by arrows) (B). (C) & (D) Whole segments of jejunum, including the muscularis- and serosal layers, cultured for 1 h with LY in the absence (C) or presence (D) of the fat mixture. As seen with mucosal explants, numerous LY-positive cells were seen after fat absorption (some marked by arrows). Bars, 20 μm. This Figure is reproduced in color in Molecular Membrane Biology online.
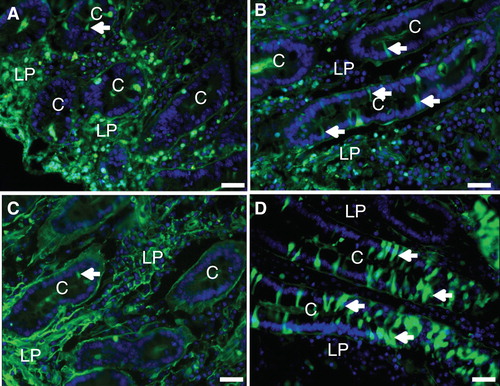
Table I. Permeabilization of crypt cells during fat absorption. Mucosal explants were cultured in the presence of LY for 30 min or 1 h in the absence (Control) or presence of a digested fat mixture (+Fat) as described in Methods. After culture, images of paraformaldehyde-fixed sections of the cultured explants were examined by immunofluorescence microscopy and the total number of identifiable crypts, the number of LY-positive crypts (i.e., crypts with at least one LY-positive cell), and the total number of LY-positive crypt cells were counted. Experiments were performed with mucosal explants obtained from two pigs, and a total number of 24 images, covering eight tissue sections (4 Controls, 4 +Fat), were analyzed.
Figure 4. Double labeling with LY and Nile red after culture for 30 min in the absence or presence of fat absorption. (A), (B), (C), (D) Both in the villus region and in the crypts, the LY-permeable enterocytes (marked by arrows) appeared morphologically similar to their LY-negative neighboring cells, both in the control and after fat absorption. In (B), the high-magnification insert shows that two LY-permeable cells had also accumulated fat droplets/chylomicrons. Bars, 20 μm. This Figure is reproduced in color in Molecular Membrane Biology online.
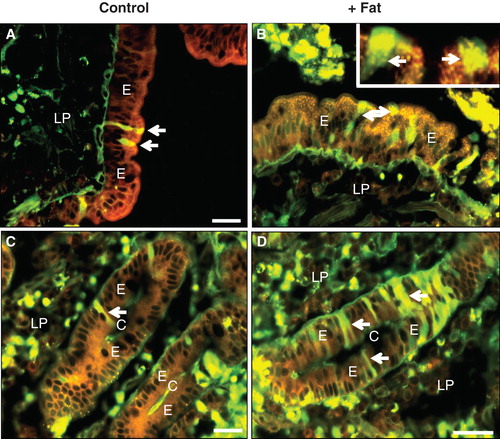
Figure 5. Cell integrity probed by membrane- and cytoskeletal markers after culture for 1 h with fat absorption in the presence of LY. After culture, sections were immunolabeled with antibodies to aminopeptidase N (a) or Na+/K+-ATPase (b). (A) Intense red labeling for aminopeptidase N was confined to the apical enterocyte brush border of the villus. (B) In the crypts, red labeling showed Na+/K+-ATPase distinctly along the basolateral membrane of enterocytes. (In both images, cells permeabilized for LY are marked by arrows). Bars, 20 μm. This Figure is reproduced in color in Molecular Membrane Biology online.
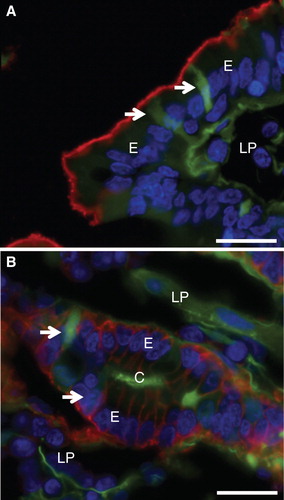
Figure 6. Cell membrane integrity probed with Ruthenium red. Mucosal explants were cultured in the absence (A) or presence (B–D) of the fat mixture for 1 h. During the last 15 min of culture, Ruthenium red was added to the medium in (A) & (B). (A) & (B) A dark staining of Ruthenium red can be seen at the enterocyte brush border and in the paracellular space (marked by arrows) in the crypts of control explants and after fat absorption. (C) Short (∼ 0.5 μm) microvilli with intact actin rootlets (marked by arrows) of immature enterocytes in the crypt. (D) Microvilli marked by asterisk in (C) shown at higher magnification. An intact membrane bilayer structure can be seen. Bars, 2 μm (A, B); 0.5 μm (C); 0.1 μm (D).
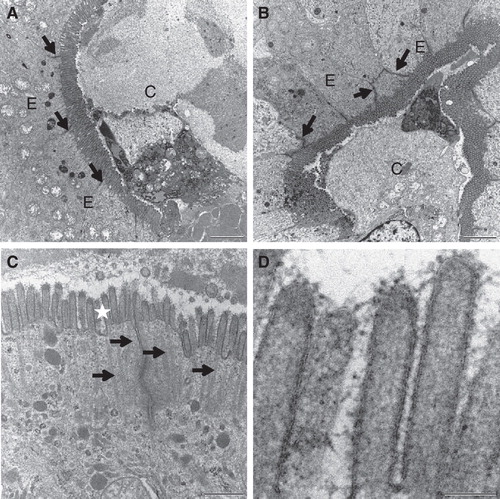
Figure 7. Effect of lipid raft disruption by a lactose wash or cholesterol removal. (A) & (B) Mucosal explants were cultured for 1 h in the presence of LY and 10 mM lactose in the absence (A) or presence (B) of the fat mixture. Lactose, which releases galectin-4 and anti-glycosyl antibodies from the brush border, did not increase the permeability of villus enterocytes to LY. (C) & (D) Mucosal explants cultured for 30 min with LY in the presence of 1% methyl-β-cyclodextrin, followed by continued culture for 30 min in the absence (C) or presence (D) of the fat mixture. Without fat, cholesterol depletion did not markedly increase the permeability of LY, but with the fat mixture, more lesions consisting of clusters of permeabilized enterocytes were observed (marked by arrows). Bars, 20 μm. This Figure is reproduced in color in Molecular Membrane Biology online.
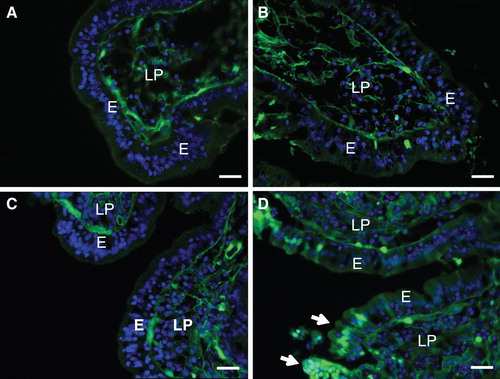
Figure 8. Fat absorption-induced uptake of FITC-albumin during culture for 1 h. (A) In the villus region of the control, albumin bound to the luminal brush border of enterocytes (marked by arrows), but no cellular uptake was detected. (B) After fat absorption, binding of albumin along the villi was patchy and scarce. (C) & (E) In the crypts of the control explant albumin was only seen in the lumen. (D) & (F) After fat absorption, albumin uptake into the cytosol and nucleus was frequently observed in enterocytes of the crypts (marked by arrows). Bars, 20 μm. This Figure is reproduced in color in Molecular Membrane Biology online.
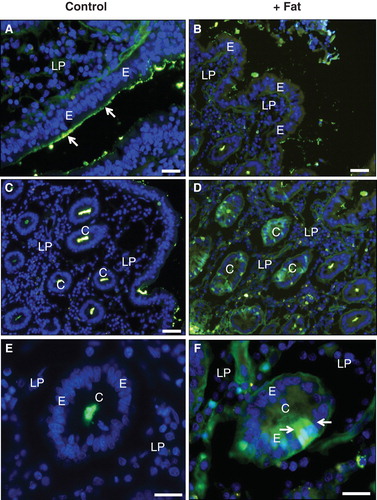
Figure 9. Uptake of FITC-ovalbumin and FITC-insulin in the crypts induced by fat absorption. (A) & (C) No uptake of ovalbumin (A) or insulin (C) occurred in the crypts of the control explant. (B) & (D) After fat absorption, both ovalbumin (B) and insulin (D) had been taken up by several enterocytes in the crypts (marked by arrows). Bars, 20 μm. This Figure is reproduced in color in Molecular Membrane Biology online.