Figures & data
Figure 1. (A) Scheme indicating the position of the domain corresponding to DENV2C6 peptide on the DENVC structure (grey shading). The dimer of DENVC has been represented (Ma et al. Citation2004). (B) Fluorescence signal amplitude of FPE versus peptide concentration in μM to determine DENV2C6 peptide binding to membrane model systems with different lipid compositions. The lipid compositions used were EPC (▪), EPC/CHOL at a molar ratio of 5:1 (○), EPC/ESM/CHOL at a molar ratio of 5:2:1 (□), EPC/EPA at a molar ratio of 5:2 (•), EPC/BPS at a molar ratio of 5:2 (▴) and synthetic ER membranes (Δ).The lipid concentration was 200 μM. Vertical bars indicate standard deviations of the mean of triplicate samples.
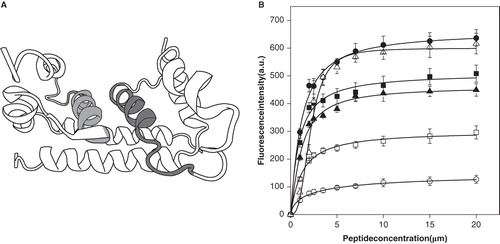
Figure 2. Effect of the DENV2C6 peptide on the release (membrane rupture) of CF (A, B, C and D), FD20 (E) and FD70 (F) for general different lipid compositions (A, B, E and F), lipid compositions containing different molar ratios of EPC, ESM and Chol (C) and the ER58:6 complex lipid mixture and its variations (D). In (A), model membranes with the following lipid compositions are shown: EPC (▪), EPC/EPA in a molar proportion of 5:2 (•), EPC BPS at a molar ratio of 5:2 (▴), total lipid liver extract (▾), ER-like membranes (◂), and EPC/BMP at a molar ratio of 5:2 (⧫). In (B), the following model membranes are shown: EPC/CHOL at a molar ratio of 5:1 (▪), EPC/CHOL at a molar ratio of 5:2 (▴), EPC/CHOL at a molar ratio of 5:3 (▴), EPC/EPA/CHOL at a molar ratio of 5:2:1 (▾) and EPC/BPS/CHOL at a molar ratio of 5:2:1 (◂). In (C), the following model membranes are shown: EPC/ESM/CHOL at a molar ratio of 5:1:1 (▪), EPC/ESM/CHOL at a molar ratio of 5:2:1 (▴), EPC/ESM/CHOL at a molar ratio of 5:3:1 (▴), EPC/ESM/CHOL at a molar ratio of 5:2:2 (▾) and EPC/ESM at a molar ratio of 5:2 (♦). In (D), the following model membranes are shown: ER 58:6 (x), ER58:6 minus Chol (▴), ER58:6 minus BPI (▾), ER58:6 minus TPE (♦), ER58:6 minus ESM (▴), ER58:6 minus BPS (◂), ER58:6 minus EPA (◊) and ER58:6 minus CL (▸). The lipid compositions of the model membranes used to study the release of FD20 (E) and FD70 (F) were: EPC (▪), EPC/CHOL in a molar proportion 5:1 (▴), EPC/ESM/CHOL in a molar proportion 5:2:1 (▴), EPC/EPA in a molar proportion 5:2 (▾), EPC/BPS in a molar proportion 5:2 (◂) and ER-like membranes (▸). Vertical bars indicate standard deviations of the mean of triplicate samples.
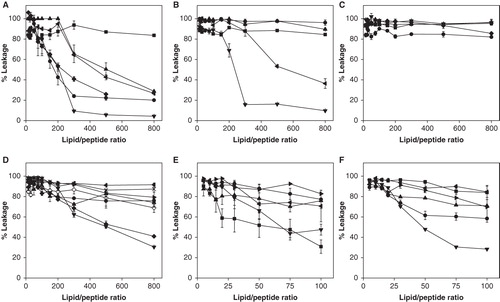
Figure 3. Steady-state anisotropy, <r>, of TMA-DPH and DPH (left and right columns, respectively) incorporated into MLVs composed of DMPC (A and B), DMPG (C and D), DMPS (E and F), DMPA (G and H), DPPC (I and J), DSPC (K and L), and 14BMP (M and N) model membranes as a function of temperature. Data correspond to vesicles in the absence (▪) and presence of the DENV2C6 peptide (○). The peptide to phospholipid molar ratio was 1:15.
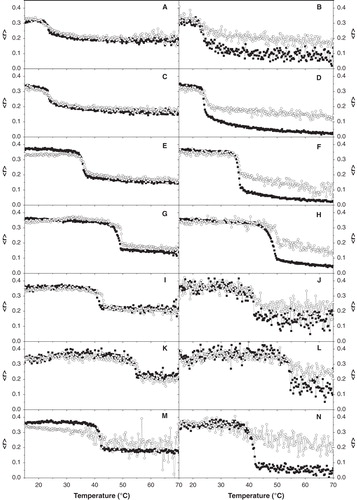
Figure 4. Differential scanning calorimetry heating thermograms corresponding to model membranes composed of (A) DMPC, (B) DEPE, (C) DMPS, (D) DMPA, (E) DMPG, (F) 14BMP and (G) PSM in the absence (top curves) and presence of DENV2C6 peptide (bottom curves) at a phospholipid/peptide molar ratio of 15:1. All the thermograms were normalized to the same amount of lipid.
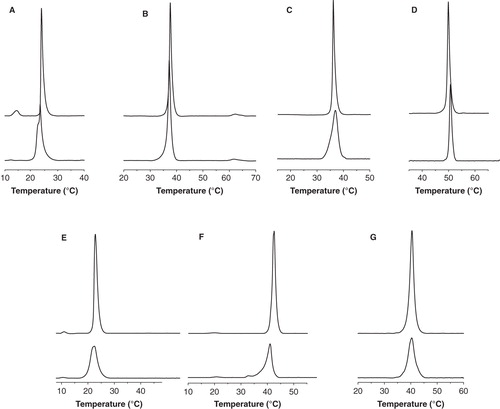
Figure 5. Stacked infrared spectra of the C = O and Amide I' regions of DENV2C6 (A) in solution and in the presence of (B) DMPC, (C) DMPG, (D) DMPG and (E) 14BMP at different temperatures as indicated. The pure phospholipid is shown on the left whereas the phospholipid/peptide mixture is shown on the right. The temperature dependence of the frequency at the maximum of the Amide I' region of DENV2C6 in solution (□) and the intensity ratio of the 1684 cm-1 and 1694 cm-1 bands (▪) are shown in the upper right figure. The phospholipid/peptide molar ratio was 15:1.
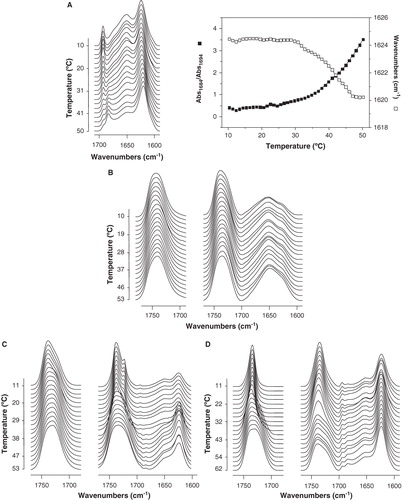
Figure 6. Temperature dependence of the frequencies of the (A, B, C) C = O carbonyl and (D, E, F) CH2 symmetric stretching bands for samples of (A, D) DMPC, (B, E) DMPG and (C, F) 14BMP in the pure form (▪) and in the presence of the DENV2C6 peptide (○). The phospholipid/peptide molar ratio was 15:1.
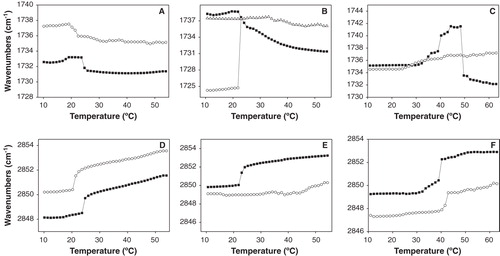
Table I. Alignment (ClustalW2) of DENV2C6 peptide from reference strains representing the major genotypes of Dengue virus. The DENV2C6 and consensus sequences are shown beneath the alignment.