Figures & data
Figure 1. Expression and purification of LIMR. (A) S2 cells stably transfected with pMT/BiP/V5-His/LIMR express a ca. 42 kDa protein 1–4 days after induction (lanes labelled 1–4), which is not present in non-induced cells (lane labelled 0), as detected by Western blotting using α-V5-HRP. (B) LIMR purification on Ni Sepharose resin, as detected by Western blotting using α-V5-HRP: FT, flow-through; W, wash; E1–E6, elution fractions 1–6. (C) LIMR purification on α-V5-agarose resin results in a protein of high relative purity, as visualized by silver staining. The band in E2 was unambiguously identified as full-length human LIMR by MALDI-MS peptide mass fingerprinting. M, marker lane.
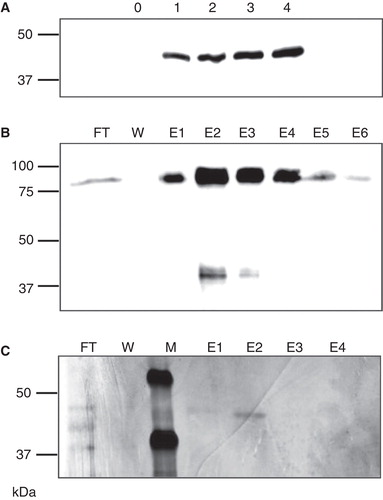
Figure 2. Peptide mass fingerprinting of LIMR. The silver stained band of purified protein (see ) was analyzed by MALDI/TOF-MS peptide mass fingerprinting. The sequence of LIMR (including tags) is shown, with the peptide fragments matched using the database search shown in bold and underlined. An additional peptide, which corresponds to the linker region between LIMR and the tags and is encoded by vector sequence, was matched manually and is shown underlined. Residues that constitute the nine putative transmembrane segments of LIMR are shown in bold italics. As is often the case, none of the transmembrane peptides were detected due to the hydrophobicity of these segments. The identified fragments, including peptide matches close to both the N- and C-termini, imply LIMR is present as the full-length receptor.
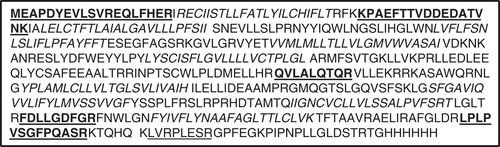
Figure 3. LIMR forms dimers and larger oligomers in DDM-solubilized form. (A) DDM-solubilized, semi-purified LIMR was separated by gel filtration on a Superose 6 column. Eluted fractions (60 fractions of 0.5 ml each) were collected and analyzed for the presence of LIMR by SDS-PAGE and subsequent Western blotting using α-V5-HRP. All LIMR was present in fractions 11–27 (lanes F11–27). (B) The relative amount of the receptor in each fraction was quantified using AIDA 2D densitometry software, resulting in the elution profile shown in the graph (light grey curve, left y-axis). A calibration curve was constructed based on the elution volumes of marker proteins (grey circles), and shows the linear relationship between the log of the molecular mass (right y-axis) and the apparent partition coefficient K av. Four distinct peaks are present in the LIMR elution profile: The major peak elutes last, in F23 and 24 or at a K av of 0.55, and presumably corresponds to dimeric LIMR (144 kDa or 2.4 times the LIMR protomer). Two additional peaks are observed that elute earlier, i.e., have a larger molecular mass, and correspond to LIMR oligomers. The small peak eluting first around F12 consists of very large aggregates (aggregation number > 100).
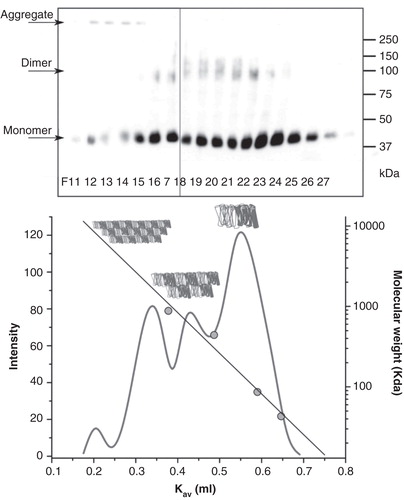
Figure 4. LIMR is a specific receptor for Lcn1, and does not exhibit high affinity for pVEG, UG or BLG. (A) SPR response curve (grey) showing the binding of Lcn1 to LIMR in a single cycle kinetics experiment, injecting 5 times 60-second (30 μl) pulses of a 2-fold concentration range of Lcn1 (1.3, 2.5, 5.0, 10, 20 μM), followed by a long dissociation phase. The response curve was fitted (black) to derive kinetic parameters from the data (). (B) SPR response curves showing the binding of UG (black, up to 0.5 μM), pVEG (grey, up to 13 μM) and BLG (black dashed, up to 50 μM) to LIMR in single cycle kinetics experiments. None of these proposed ligands interact with the receptor. The presence and activity of LIMR on the chip surface was confirmed after each experiment by injection of Lcn1, which bound as expected in all cases. Doubly corrected data are shown in both panels, after subtraction of the signal from a reference flow cell, and of the signal from 5 times 60-second pulses of buffer injection over the receptor flow cell.
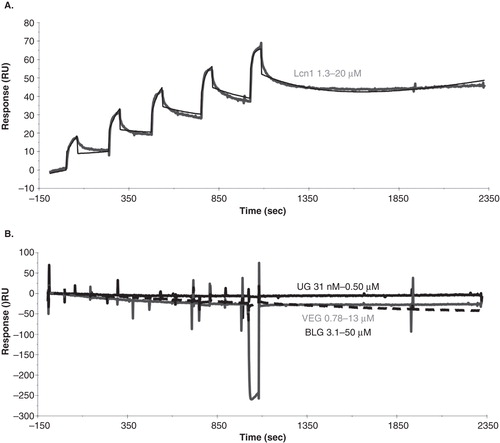
Table I. Experimental variables and kinetic parameters for the binding of Lcn1 to LIMR from four independent SCK experiments.