Figures & data
Figure 1. Cytotoxicity of lysoPC in MG-63 cells. (A) Dose-response curve of MTT activity (relative to control without lysoPC) following 48-h exposure to increasing concentrations of lysoPC in serum-free culture medium. Values are mean ± SEM of five independent experiments performed in triplicates. (B) Dose-response analysis of cell viability (relative to control without lysoPC) following 48-h exposure to increasing concentrations of lysoPC in serum-free culture medium, as measured through crystal violet staining and cell counts. Values are mean ± SEM of three independent experiments in triplicates.
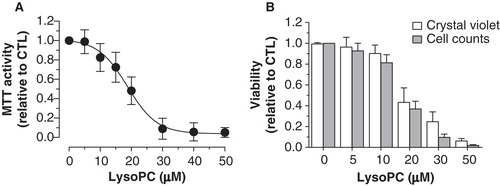
Figure 2. LysoPC promotes cell death by apoptosis and necrosis. MG-63 cells seeded in 12-well plates were incubated in serum-free culture medium without lysoPC (CTL) or in the presence of increasing concentrations of lysoPC for 24 h. (A) Adherent cells were then labeled with FITC-annexin-V and propidium iodide (PI) and fluorescence was analyzed by flow cytometry. (B) Percentage of cell number relative to the control without lysoPC are shown as a function of increasing concentrations of lysoPC for viable cells, early apoptosis, late apoptosis and necrosis. Values are mean ± SEM of seven independent experiments compared to control without lysoPC using a Dunnett test: *p < 0.05, **p < 0.01, ***p < 0.001
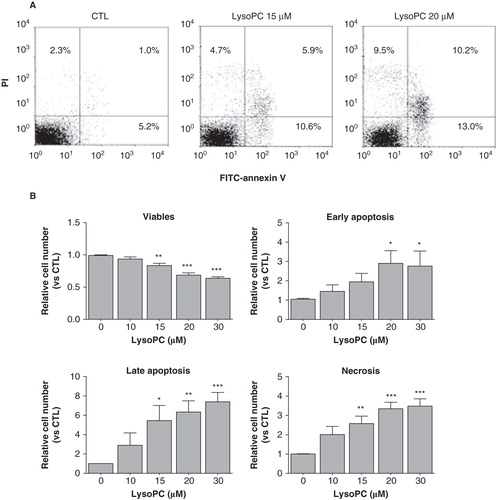
Figure 3. Involvement of extracellular calcium in the lysoPC-induced cell death. (A) Dose-response curve of MTT activity (relative to control without lysoPC) following 48-h exposure to increasing concentrations of lysoPC in serum-free medium with low 0.25 mM calcium concentration or normal 1 mM calcium concentration. Values are mean ± SEM of five independent experiments in triplicates. Bonferroni post test: ***p < 0.001 when compared to condition with nomal 1 mM calcium. (B) Fluo-3 loaded cells were transferred to HBSS without calcium and then lysoPC (10 or 20 μM) were added to the incubation medium. Thereafter, calcium was added to the incubation buffer to determine calcium influx. Fluo-3 fluorescence values relative to basal fluorescence are showed as mean ± SEM of 3–5 experiments with analyses of 7–8 fields per experiment (between 10 and 20 cells per field).
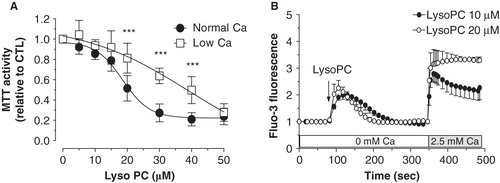
Figure 4. Characterization of calcium mobilization induced by lysoPC. (A) Cells loaded with Fluo-3 were transferred to HBSS without calcium and then calcium depletion of the endolasmic reticulum was achieved by two subsequent additions of thapsigargin (Tg 5 μM). Thereafter, lysoPC (10 μM) were added to the incubation medium. Calcium was added to the incubation buffer to determine calcium influx. (B) Cells loaded with Fluo-3 were transferred to HBSS without calcium and preincubated with 10 μM U73122 for 5 min. Thereafter, lysoPC (10 μM) were added to the incubation medium. Measurements of intracellular calcium were performed with a laser scanning confocal as described in the Material and methods section. Thereafter, calcium was added to the incubation buffer to determine calcium influx. Values are mean ± SEM of three independent experiments with analyses of 7–8 fields per experiment (between 10 and 20 cells per field).
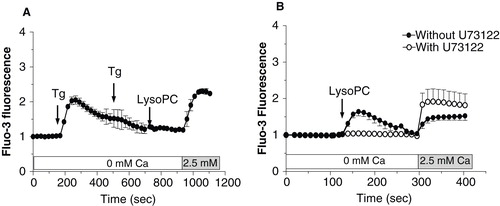
Figure 5. Characterization of calcium influx induced by lysoPC. Cells loaded with Fluo-3 were transferred to HBSS without calcium and preincubated with 100 μM Gd3+ (A, C) or 10 μM RR (B, D) for 5 min. Thereafter, 5 μM Tg (A, B) or 10 μM lysoPC (C, D) were added to the incubation medium. Calcium was added to the incubation buffer to determine calcium influx. Values are mean ± SEM of three individual experiments with analyses of 7–8 fields per experiment (between 10 and 20 cells per field).
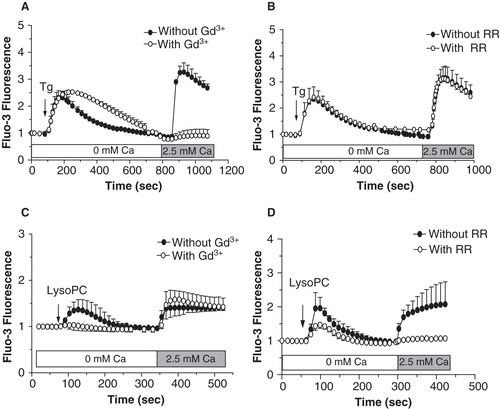
Figure 6. Expression of TRPV channels by MG-63 cells. (A) Total RNA was isolated from MG-63 and used for synthesis of complementary DNA. Amplifications by PCR were performed with specific primers for human TRPV2 or TRPV4. Representative data are shown from RNA isolations of at least three independent cultures with amplified DNA of 686 and 866 bp for TRPV4 (corresponding to variants 2 and 3, and to variants 1, 4 and 5, respectively) and of 432 bp for TRPV2. L: ladder of 100 bp. (B) Localization of TRPV2 and TRPV4 proteins were performed by confocal microscopy with specific antibodies, and revealed by secondary fluorescence antibodies. To ascertain specific fluorescence, primary antibodies have been incubated with related antigens (Ag). Representative data are shown from at least three independent cultures.
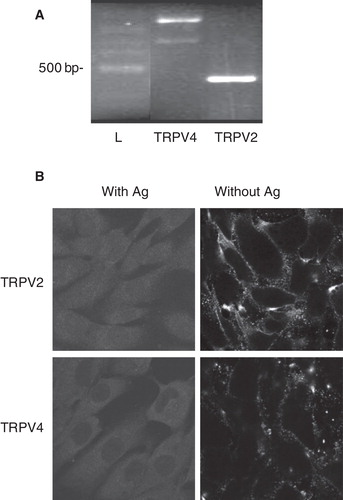
Figure 7. Involvement of TRPV activation in lysoPC-induced cell death of MG-63 cells. (A) Dose-response curve of MTT activity (relative to control without lysoPC) following 48-h exposure to increasing concentrations of lysoPC in culture medium alone (Control) or with 10 μM RR, 30 μM RN 1734 or 100 μM Tranilast (Tran). Results are from five independent experiments in triplicates. Bonferroni post test: *p < 0.05, **p < 0.01 when compared to control condition. (B) Cells loaded with Fluo-3 were transferred to fresh HBSS with 2.5 mM calcium. Thereafter, cells were preincubated for 5 min without or with 30 μM RN 1734. After, GSK1016790A (GSK, 10 nM) was added to the incubation medium and fluorescence was measured. Values are mean ± SEM of the relative fluorescence compared to basal level of five individual experiments with analyses of 7–8 fields per experiment (between 10 and 20 cells per field). (C) Dose-response curve of MTT activity (relative to control without GSK) following 48-h exposure to increasing concentrations of GKS1016790A in serum-free culture medium. Values are mean ± SEM of three independent experiments performed in triplicates. (D) Fluo-3 loaded cells were transferred to HBSS without calcium and then lysoPC (10 μM) were added to the incubation medium. Thereafter, calcium was added to the incubation buffer to determine calcium influx. Fluorescence values corresponding to calcium influx relative to calcium influx induced by lysoPC are showed as mean ± SEM of 3–5 experiments with analyses of 7–8 fields per experiment (between 10 and 20 cells per field). Dunnett post test: **p < 0.01, ***p < 0.001 when compared to control condition with lysoPC alone. (E) Cells loaded with Fluo-3 were transferred to fresh HBSS with 2.5 mM calcium. Thereafter, cells were preincubated for 5 min without or with 10 μM RR. After, cannabidiol (Can, 10 μM) was added to the incubation medium and fluorescence was measured. Values are mean ± SEM of three individual experiments with analyses of 7–8 fields per experiment (between 10 and 20 cells per field). (F) Dose-response curve of MTT activity (relative to control without cannabidiol) following 48-h exposure to increasing concentrations of cannabidiol in serum-free culture medium. Values are mean ± SEM of four independent experiments performed in triplicates. One-way ANOVA, p < 0.0001.
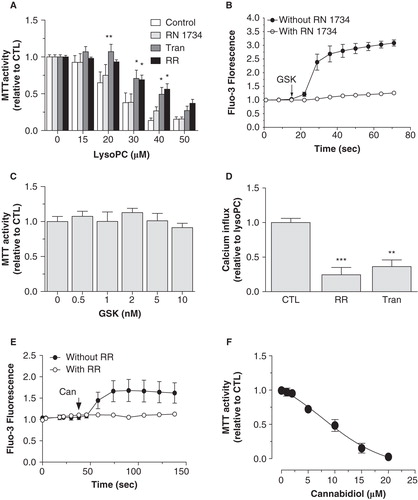
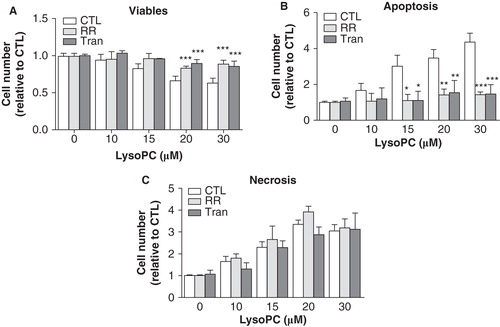
Figure 8. Stimulation of TRPV channels by lysoPC promoted cell apoptosis. MG-63 cells seeded in 12-well plates were incubated in serum-free culture medium without or with 10 μM RR or 100 μM Tranilast (Tran) in the presence of increasing concentrations of lysoPC for 24 h. The cells were then labeled with annexin-V-FITC and propidium iodide (PI) and fluorescence was analyzed by flow cytometry for viable (negative for annexin and PI), apoptotic (positive for annexin and negative for PI) and necrotic (negative for annexin and positive for PI) cells. Values are mean ± SEM of nine independent experiments. Bonferroni post test: *p < 0.05, **p < 0.01, ***p < 0.001 when compared to condition without RR or Tranilast.