Figures & data
Figure 1. Purification and in vitro reconstitution of holo-cytochrome b6. (A) SDS-PAGE analysis (10% SDS-gel) of the apo-cytochrome b6 expression and purification. 1: Cell extract before induction; 2: total cellular extract; 3: soluble proteins; 4: inclusion bodies; 5: affinity purified apo-cytochrome b6 fused to MBP. (B, C) Absorbance spectra show specific binding of heme to apo-cytochrome b6 under oxidizing (B) and reducing (C) conditions. Vis spectra of free heme (dark grey) and 150 μg in vitro reconstituted apo-cytochrome b6 (grey) are shown. The inset in Figure (C) shows the redox difference spectrum.
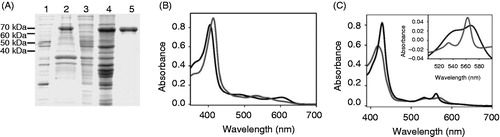
Figure 2. Chlorophyll a does not associate with apo-cytochrome b6. Absorbance spectra of free chlorophyll a (dark grey) and chlorophyll a after addition of 150 μg cytochrome b6 (grey) recorded under oxidizing conditions.
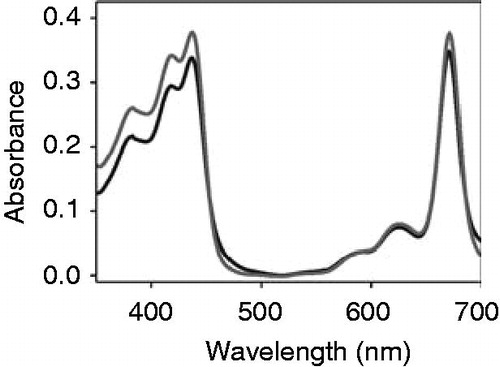
Table 1. Absorbance maxima offree protoporphyrin IX derivatives (without cyt b6) and in presence ofcytochrome b6 (with cyt b6) are listed. The bandwidth at half maximum (fwhm) is given for the Soret band (γ-band) of each spectrum. Absorbance maxima and the fwhm values were obtained after Gaussian deconvolution of the respective absorbance curve using the program PeakFit (Systat Software, Inc.).
Figure 3. Heme but not chlorophyll co-elutes with cytochrome b6 after in vitro reconstitution. Free heme and chlorophyll a, respectively, were added to isolated apo-cytochrome b6 and the protein was purified via Ni-NTA chromatography. After elution of the protein, absorbance spectra were recorded under oxidizing (dark grey) and reducing conditions (grey) in case of heme. Chlorophyll a did not elute from the column together with the protein, therefore a chlorophyll a spectrum is not visible (light grey).
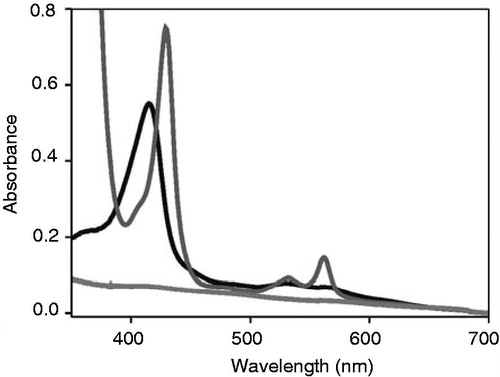
Figure 4. Apo-cytochrome b6 does not bind porphyrins with central and porphyrins in presence of 145 μg apo-cytochrome b6 (grey) and porphyrins in presence of 145 mg apo-cytochrome b6 (grey) are show nunder oxidizing conditions. (A) ProtoporphyrinIX, (B) Mg-protoporphyrin IX.
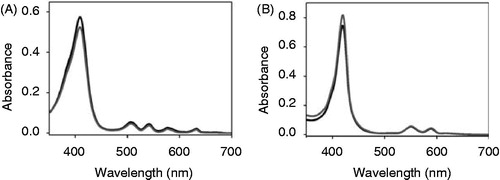
Figure 5. Chemical structures ofheme, chlorophyll a and protoporphyrin IX derivatives used in this study. Arrows indicate side chains varied compared to heme. In Fe-deuteroporphyrin IX ethylene side chains 2 and 4 are substituted for hydrogen atoms whereas in Fe-protoporphyrin IX dimethylester the propionyl groups 6 and 7 are esterified with methyl groups.
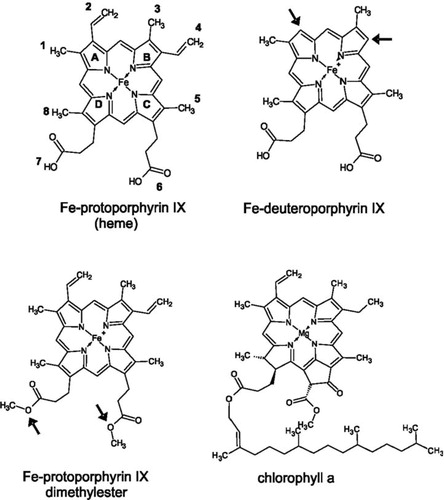
Figure 6. Apo-cytochrome b6 binds porphyrins with modified side chains. Absorbance spectra of Fe-deuteroporphyrin IX (A, B) as well as of Fe-protoporphyrin IX dimethylester (C, D) were recorded under oxidizing (A, C) and reducing (B, D) conditions. The spectrum of free porphyrin (dark grey) is compared to the spectrum of the porphyrin after addition of 150 μg apo-cytochrome b6 (grey). The insets in (B) and (D) are redox difference spectra.
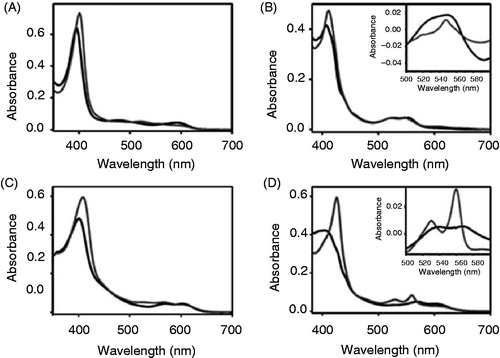
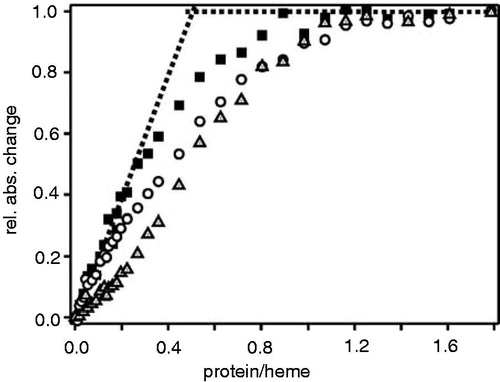
Figure 7. Porphyrin binding isotherms for cytochrome b6. Increasing amounts ofapo-cytochrome b6 were titrated into buffer containing either 5 μM heme (squares), Fe-deuteroporphyrin IX (circles) or Fe-protoporphyrin IX dimethylester (triangles). The protein-to-heme ratio was plotted against the normalized absorbance change at 413 nm. Each data point represents an individual measurement.