Figures & data
Figure 1. Evidence if WSCM-induced EMT in BPH-1 cells. Cells cultured in ordinary RPMI 1640 medium (BPH-1) and WPMY-1 supernatant (WSCM-BPH-1). WPMY-1 cells were photographed as a control. (A) Cells were cultured in different media for 5 days and photos were taken using a phase contrast microscope. Scale bar: 20 μm. (B) Western blot analysis of EMT-related proteins in BPH cells after 7 days’ culture period. Western blotting was performed on cell lysates using antibodies against EMT markers under different culture conditions. (C) Relative protein levels. Films were scanned and relative density of each band was calculated as ratio to GAPDH. Data are mean ± SD from 3 separate experiments. *p < 0.05. (D) Immunofluorescent staining of EMT marker proteins after 7 days’ cell culture. Immunofluorescent staining was performed as described in Materials and methods. Specific proteins were FITC labeled (green) and cell nuclei were stained with DAPI (blue, with exception of Snail). Photos were taken using a fluorescent microscope. (E) Migration assay. Crystal violet staining results showed WSCM can promote BPH-1 cell migration, Scale bar: 20 μm. *p < 0.05. (F) MTT assay. WSCM treatment did not alter the growth of BPH-1 cells after 1, 3 and 5 days of culture.
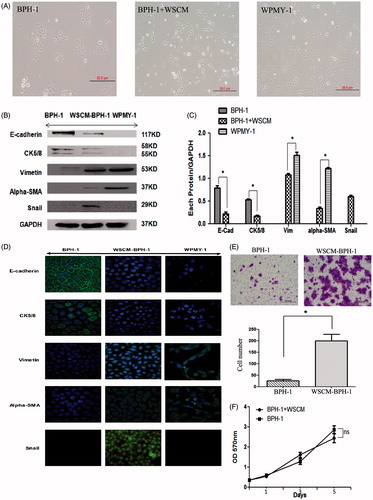
Figure 2. Effect of TGF-β1 on WSCM-induced EMT in BPH-1 cells. BPH-1: BPH-1 cells cultured in ordinary culture condition; WSCM-BPH-1: BPH-1 cells cultured in WPMY-1 supernatant; BPH-1 + IgG: BPH-1 cells cultured in ordinary culture condition plus mouse IgG; BPH-1 + WSCM + IgG: BPH-1 cell cultured in WSCM medium plus mouse IgG. WSCM-anti-TGF-β1: BPH-1 cells cultured in WSCM medium plus anti-TGF-β1 antibody. WPMY-1: a prostate stromal ell line. (A) Morphological changes under different culture conditions. Scale bar: 20 μm. (B) Western blotting analysis of EMT marker protein expression. BPH-1 cells were lysed after cultured in different conditions. (C) Relative protein levels. Films were scanned and relative density of each band was calculated as ratio to GAPDH. Data are mean ± SD from 3 separate experiments. *p < 0.05. (D) Immunofluorescent staining of EMT marker proteins. Immunoflorescent staining was performed as described in Materials and methods. Specific proteins were FITC labeled (green) and cell nuclei were stained with DAPI (blue, with exception of Snail). Photos were taken using a fluorescent microscope. (E) Migration assay. Anti-TGF-β1 Ab was added into the culture system and detect the migration capability of BPH-1 cells induced by WSCM. Scale bar: 20 μm. *p < 0.05.
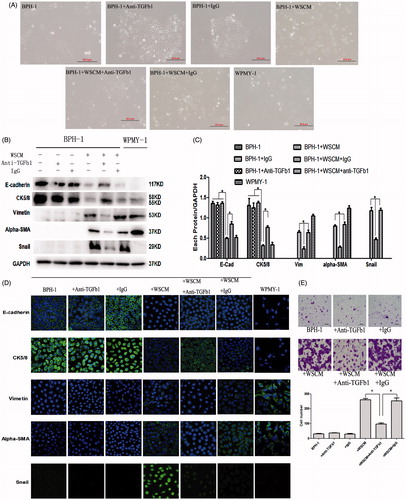
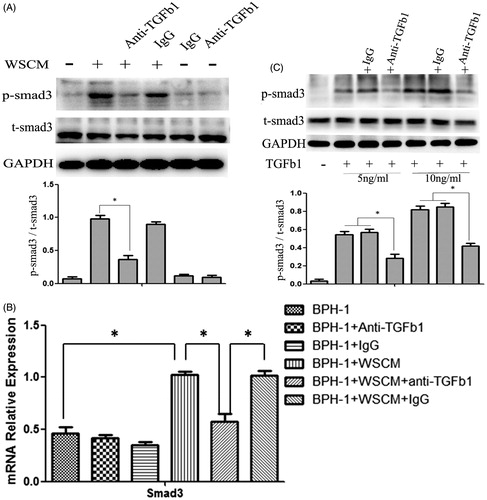
Figure 3. Smad3 expression in BPH-1 cells. BPH-1: BPH-1 cells cultured in ordinary culture condition; BPH-1 + IgG: BPH-1 cells cultured in ordinary culture condition plus mouse IgG; BPH-1 + anti-TGF-β1: BPH-1 cells cultured in ordinary culture condition plus anti-TGF-β1 Ab; BPH-1 + WSCM: BPH-1 cells cultured in WPMY-1 supernatant; BPH-1 + WSCM + anti-TGF-β1: BPH-1 cells cultured in WSCM medium plus anti-TGF-β1 antibody; BPH-1 + WSCM + IgG: BPH-1 cell cultured in WSCM medium plus mouse IgG. (A) Western blot analysis of protein level of phosphorylated-Smad3 after 1 day treatment. (B) Q-PCR analysis of mRNA level of total Smad3 after 7 days’ treatment. (C) Smad3 expression in the cells treated with 5 ng/ml and 10 ng/ml TGF-β1.