Figures & data
Figure 1. Graph extracted and adapted from (Sheetz, Citation1979) with permission from Elsevier. The graph shows the buoyant density (black, filled circles) and the phosphate content (empty squares) of cytoskeletons extracted from whole RBCs at various TX100 concentrations, at 4 °C. The vertical line marked “50 mg/ml of cells” refers to the TX100 concentration most commonly used in extracting lipid rafts from human erythrocytes (either with or without carbonate, see text for details).
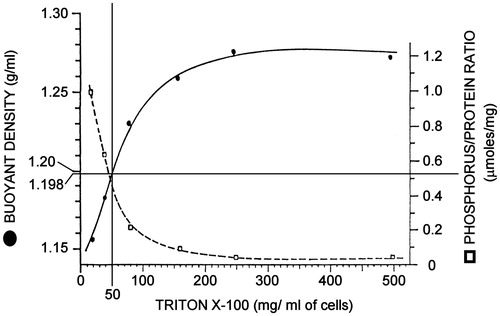
Figure 2. Isolation of lipid raft-like material from whole human RBCs. Pure RBCs were obtained by filtration of blood through cellulose and incubated (1.25 × 10⁹ cells) for 30 min at 4 °C in HKM buffer (10 mM HEPES, 150 mM KCl, 4.5 mM NaCl, 1 mM MgCl2) containing 1% (w/v) TX100, in a final volume of 625 μl. The sample was then mixed with an equal volume of 80% (w/v) sucrose in HKM (tube 1) or in 0.3 M K2CO3 (tube 2) and transferred to an ultracentrifuge tube. Sucrose solutions in HKM [2.5 ml of 30% (w/v) sucrose followed by 1.25 ml 5% (w/v) sucrose] were layered on the samples and the tubes spun for 16 h at 225 000 gmax. Lower arrow indicates the interface between 40% and 30% sucrose. Upper arrow indicates the interface between 30% and 5% sucrose.
![Figure 2. Isolation of lipid raft-like material from whole human RBCs. Pure RBCs were obtained by filtration of blood through cellulose and incubated (1.25 × 10⁹ cells) for 30 min at 4 °C in HKM buffer (10 mM HEPES, 150 mM KCl, 4.5 mM NaCl, 1 mM MgCl2) containing 1% (w/v) TX100, in a final volume of 625 μl. The sample was then mixed with an equal volume of 80% (w/v) sucrose in HKM (tube 1) or in 0.3 M K2CO3 (tube 2) and transferred to an ultracentrifuge tube. Sucrose solutions in HKM [2.5 ml of 30% (w/v) sucrose followed by 1.25 ml 5% (w/v) sucrose] were layered on the samples and the tubes spun for 16 h at 225 000 gmax. Lower arrow indicates the interface between 40% and 30% sucrose. Upper arrow indicates the interface between 30% and 5% sucrose.](/cms/asset/78c1ea0e-cea9-496f-be67-713906ed9bf2/imbc_a_896485_f0002_b.jpg)
Figure 3. Isolation of lipid raft-like material from whole human RBCs. RBCs were not purified by filtration through cellulose, but only washed three times with PBS. RBCs (1.25 × 10⁹) were pre-treated (tube 2) or not (tube 1) with 5 mM DFP for 10 min at room temperature, washed extensively with PBS and incubated for 30 min at 4 °C in HN buffer (5 mM HEPES, 150 mM NaCl, 4.5 mM KCl) containing 1% (w/v) TX100, in a final volume of 625 μl. The sample was then mixed with an equal volume of 80% (w/v) sucrose in HN and transferred to an ultracentrifuge tube. Sucrose solutions in HN [2.5 ml of 30% (w/v) sucrose followed by 1.25 ml 5% (w/v) sucrose] were layered on the samples and the tubes spun for 4 h at 225 000 gmax. The arrow indicates the low-density DRM fraction.
![Figure 3. Isolation of lipid raft-like material from whole human RBCs. RBCs were not purified by filtration through cellulose, but only washed three times with PBS. RBCs (1.25 × 10⁹) were pre-treated (tube 2) or not (tube 1) with 5 mM DFP for 10 min at room temperature, washed extensively with PBS and incubated for 30 min at 4 °C in HN buffer (5 mM HEPES, 150 mM NaCl, 4.5 mM KCl) containing 1% (w/v) TX100, in a final volume of 625 μl. The sample was then mixed with an equal volume of 80% (w/v) sucrose in HN and transferred to an ultracentrifuge tube. Sucrose solutions in HN [2.5 ml of 30% (w/v) sucrose followed by 1.25 ml 5% (w/v) sucrose] were layered on the samples and the tubes spun for 4 h at 225 000 gmax. The arrow indicates the low-density DRM fraction.](/cms/asset/5ccaf8b9-17af-4511-88ae-8d783ec26590/imbc_a_896485_f0003_b.jpg)
Figure 4. Physical states of the lipid bilayer. Here a lipid bilayer made of a single phospholipid is in a solid gel-like, ordered state when the temperature is below the Tm of the phospholipid, and in a liquid-crystalline (lc), or liquid-disordered (ld) state when the temperature is above the Tm. An additional mesomorphic state has been described when cholesterol is present in the system above a certain molar ratio over phospholipids. In this case the cholesterol molecule (black oval) can fluidize the solid-ordered phase and render more ordered the liquid-disordered phase, generating an intermediate state, which was termed liquid-ordered (lo) phase. The bilayer in the lo phase is thicker than that in the lc or in the solid-ordered phase. See text for additional details. Redrawn from (Munro, Citation2003).
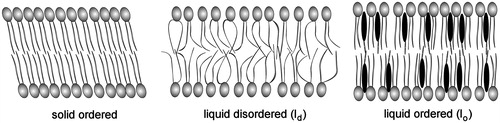
Figure 5. A spectrin tetramer, with two spectrin heterodimers associated head-to-head. The regions marked with circles contain the α-spectrin 8, 9 and 10 triple-helical repeats and the β-spectrin 12, 13 and 14 triple-helical repeats where high-affinity binding sites for PS map (An et al., Citation2004). The binding site for ankyrin (“ank”) is located in the 15th helical repeat of β-spectrin (Bennett & Baines, Citation2001).
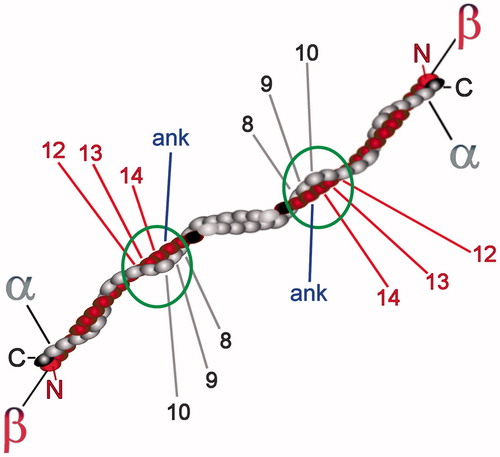
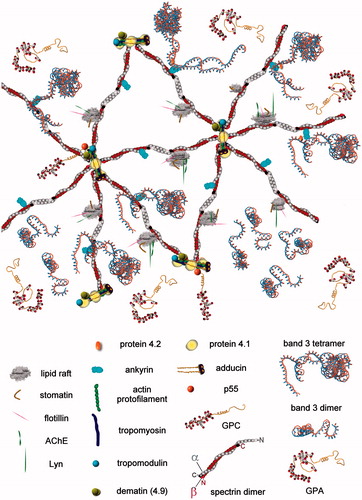
Figure 6. A portion of the membrane-skeleton is shown, as obtained after a hypothetical solubilization of the membrane with 1% TX100 under the conditions for obtaining DRMs but with the omission of carbonate, so that DRMs remain associated with the spectrin skeleton. The cartoon depicts the hypothetical direct interaction of DRMs with the spectrin dimer in a region where the highest affinity of spectrin for certain lipid classes was previously described, near the head-to-head association of spectrin dimers into tetramers. The same region in the spectrin dimer also contains the binding site for ankyrin, so that its interaction with ankyrin and the DRM is mutually exclusive. The various proteins are only approximately drawn to scale, but their oligomeric state and interactions are respectful of the current knowledge. See text for additional explanations.