
Figures & data
Figure 1. Snake plot of the amino acid sequence of human GPR40 showing the thermostabilized sites. Blue, increase (%) in activity in the fasiglifam-binding condition (G29, T31, L38, C127, A128, A129, W131, A132, L133, V134, E145, G149 and V225); yellow, increase (%) in activity in the compound-free condition (V64, A109, Y122, L135, A199, F200, G204, V237, G265, T286 and V287); red, increase (%) in activity in both conditions (L42, F88, G103, R104, Y202 and K285); gray, not tested or fasiglifam binding signal for the mutant <25% of the signal for the wild-type; *binding signal of fasiglifam not determined for both tyrosine-to-alanine and tyrosine-to-phenylalanine mutants; **binding signal of fasiglifam not determined for tyrosine-to-alanine mutant but determined for tyrosine-to-phenylalanine mutant; ***increase (%) in activity for tyrosine-to-phenylalanine mutant; ****increase (%) in activity for both tyrosine-to-alanine and tyrosine-to-phenylalanine mutants.
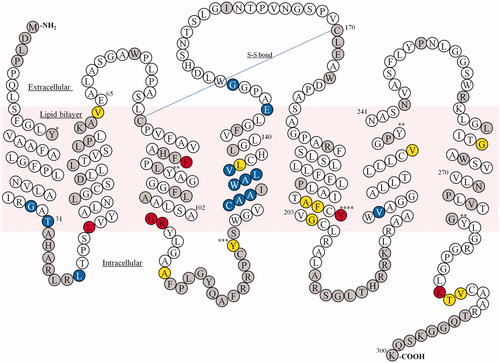
Figure 2. Apparent Tm (, °C) of the wild-type and the thermostabilized four-point mutant of GPR40. Binding signals at each temperature were normalized as percentages of the binding signal at 4 °C. This experiment was performed in sextuplet. Data are expressed in means ± SEM and were fitted using the sigmoidal dose-response curve equation of Prism 5.03 software. Closed circles, the wild-type under format A condition; open circles the wild-type under format B condition; closed triangles, thermostabilized four-point mutant under format A condition; open triangles, thermostabilized four-point mutant under format B condition.
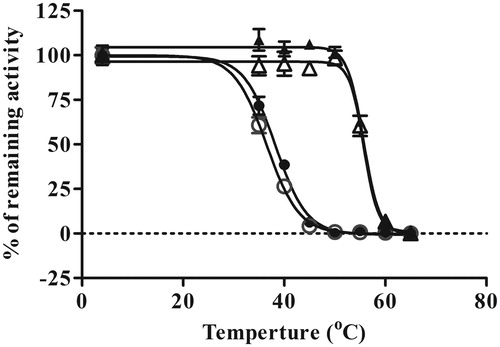
Table 1. Apparent Tm (, °C) values of wild-type and single-point thermostabilized mutants of GPR40.
Table 2. values (°C) of wild-type and the thermostabilized four-point mutant of GPR40.
Figure 3. Fasiglifam binding affinity for the wild-type and the thermostabilized four-point mutant of GPR40. Saturation binding curves of fasiglifam for the wild-type (a) and the thermostabilized four-point mutant (b) were determined by the SEC/LC-MS-based binding assay. The specific binding signal for the receptor (open triangles) was calculated as the difference between the total binding signal (solid circles) and the non-specific binding signal (solid squares). This experiment was performed in sextuplet Data are expressed in means ± SEM and were fitted using the one site-specific binding curve equation of Prism 5.03 software.
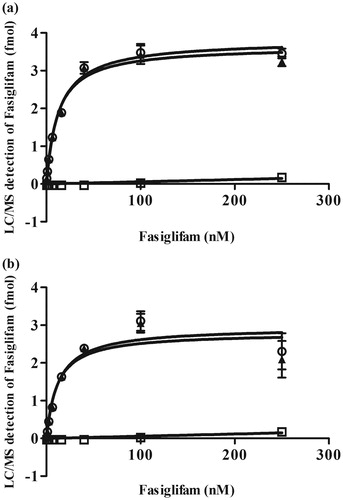
Table 3. values of fasiglifam and Bmax for wild-type and the thermostabilized four-point mutant of GPR40.
Figure 4. Agonistic activity of fasiglifam (a) and DHA (b) in wild-type (circles) and the thermostabilized four-point mutant of GPR40 (squares). The experiment was performed in quadruplicate. Data are expressed in means ± SEM and were fitted using the dose-response equation of Prism 5.03 software.
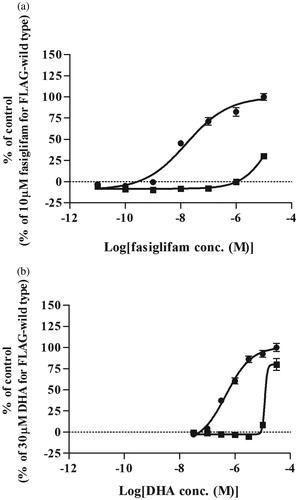
Figure 5. Transient expression level of wild-type and the thermostabilized four-point mutant GPR40 on the HEK-293T cell surface detected by FACS. The experiment was performed in triplicate. Data are expressed in means ± SEM.
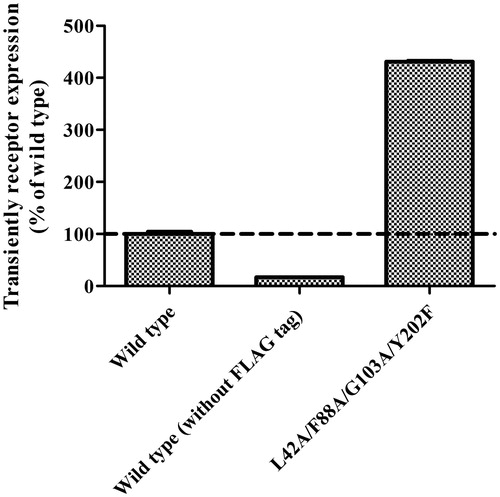
Table 4. Agonistic activity (EC50) of fasiglifam and DHA for the FLAG-tagged wild-type and FLAG-tagged thermostabilized four-point mutant of GPR40.