Figures & data
Table 1. Summary of microscopy techniques.
Figure 1. Different plasma membrane models. (A) Fluid mosaic model presents the plasma membrane as a two-dimensional liquid in which proteins (orange and blue shapes) are homogenously distributed in the lipid bilayers (dark blue). This model allows the possibility of rapid lateral diffusion of lipids and proteins within the membrane. (B) The lipid raft model proposes the existence of small regions (green shapes) enriched in cholesterol (red shapes) and sphingolipids. (C) The picket fence model suggests that transmembrane proteins act as “pickets” (orange pink and blue shapes) and the membrane skeleton as “fences” (dark orange net). The membrane skeleton confines the diffusion of membrane components due to collision. The membrane is depicted from cytosolic side. (D) The lipid shell model suggests that 25% of the cell membrane surface contains proteins (orange shapes) which are surrounded by lipid rings (purple and pink). (E) The models are exclusive and it is likely that different various membrane domains and compartments coexist in the plasma membrane.
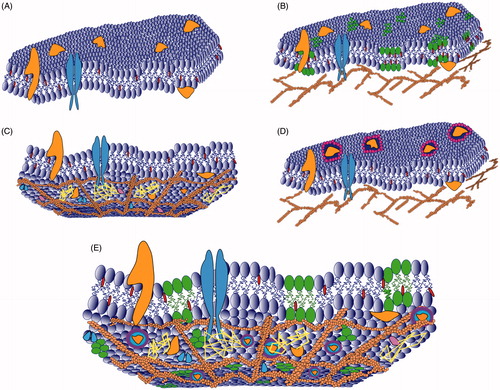
Figure 2. Spectral and lifetime methods of analysis to detect lipid phases. (A) The plasma membrane is depicted with the membrane dye Laurdan (orange shapes) in a random distribution between liquid disordered phase (Ld, blue lipids) and liquid ordered phase (Lo, green lipids). (B) Schematic emission spectra of lipid-phase sensitive dye, Laurdan, with green and purple spectra corresponding to Lo and Ld phases, respectively. (C) Typical fluorescence lifetime decays correspond to liquid ordered (dotted line) and liquid disordered (solid) phases, respectively. (D) Transformation of a spectrum or decay into a phasor (vector) plot. Spots represent data for Lo (lower) and Ld (upper) phases.
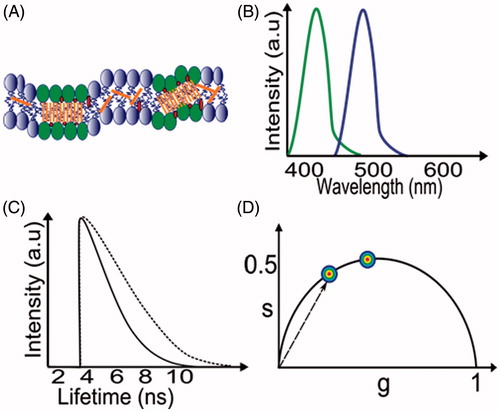
Figure 3. Fluorescent approaches for detection of protein interactions and dynamics. (A) Fluorescence resonance energy transfer (FRET) with the most commonly used fluorescent protein pair, CFP-YFP. Middle scheme: FRET does not occur because of a large distance between the CFP and YFP proteins. Right scheme: FRET occurs when the distance (R0) between donor and acceptor is below 10 nm. (B) Fluorescence correlation spectroscopy (FCS). Middle scheme: The cross correlation function between two proteins is constant because the proteins are not assembled into complexes or the distance between them is too large. Right scheme: the cross correlation function indicates the presence of a protein complex. (C) Fluorescence recovery after photobleaching (FRAP). Middle scheme: a region of interest is photobleached region (black square). Right scheme: recovery of fluorescence intensity.
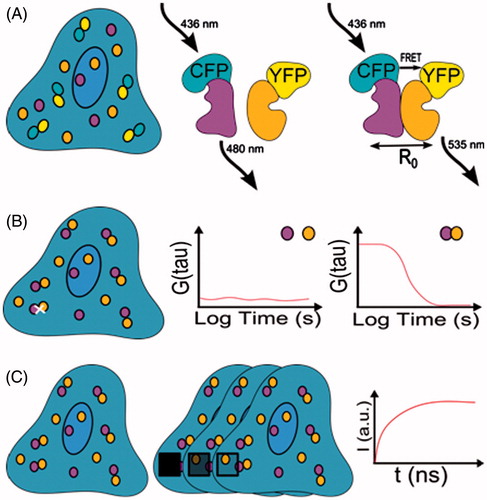
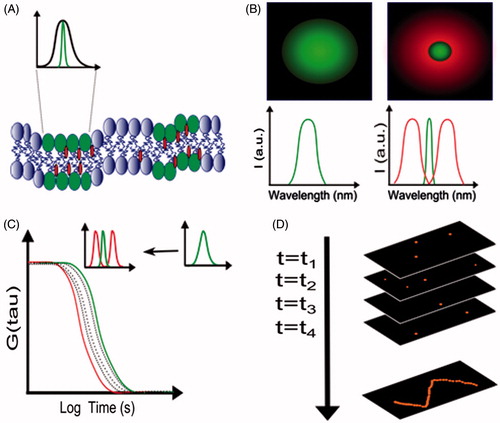
Figure 4. Super-resolution methods. (A) Features in the plasma membrane such as lipid rafts are below (green PSF) the diffraction limit (black PSF). (B) Stimulated emission depletion (STED). Left panel: PSF of confocal beam. Right panel: PSF of STED beam where in a doughnut shaped STED beam is overlaid onto a confocal beam (green) which reduces the focal volume. (C) Combination of STED and FCS. The autocorrelation function is shifted towards shorter time when STED is applied to FCS, which allows a precise quantification of the diffusion coefficient. (D) Photo-activated localization microscopy (PALM) or stochastic optical reconstruction microscopy (STORM). Single molecules are photo-activated so that there are a limited number of fluorescent events in each frame. The PSF of each fluorescent event is analysed to obtain the localizations of each molecule with nanometre precision. All localization are combined to produce a super-resolution image.