
Figures & data
Figure 1. Folding model of the membrane domain of human AE1 with 14 TM segments based on the crystal structure of the related Escherichia coli UraA H+-uracil transporter (Cordat & Reithmeier, Citation2014). Rectangles represent helical regions and residue numbers indicate limits of TM segments. TM3 and 10 each contain an extended region indicated by an arrow and a short helical region. The single N-glycosylation site is located at Asn642 between TM7 and 8, and the active site Glu681 within TM8. The H2DIDS reactive site is located at Lys539 at the end of TM5 and its crosslinking site at Lys851 in the extracellular loop connecting TM 13 and 14. The positions of the seven tryptophan residues (W) are indicated in bold italics. Trp492 and Trp496 are located on the same side of the helix forming TM4. Trp648 is located in an extracellular hydrophilic loop six residues distal from the N-glycosylation site. Trp662 is an interfacial residue located at the beginning of TM8, while Trp723 is located at the beginning of TM10. Trp831 is in a cytosolic loop near the beginning of TM13, while Trp848 is an interfacial residue at the extracellular end of TM13.
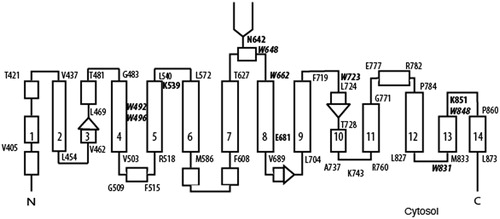
Figure 2. Immunoblot analysis of C-terminal His6-tagged AE1 and Trp mutants expressed in transfected HEK-293 cells. Cells were grown in six-well plates transfected with 1 μg cDNA per well and were solubilized in 1% C12E8 after 48 hours growth. Total cell proteins were resolved by SDS-PAGE and transferred to a nitrocellulose membrane. A mouse monoclonal anti-AE1 antibody was used to detect AE1 (upper panel) and a mouse monoclonal anti-GAPDH antibody was used to detect endogenous GAPDH (lower panel) as a protein loading control. Panel A shows the expression levels of the Ala substitutions and Panel B shows the Phe substitutions. Panel C show protein expression of the Trp mutants normalized to GAPDH expression (dark bar: Ala substitutions, light gray bar: Phe substitutions) from three independent transfection experiments. The percent expression level of WT AE1 was set to 100%. The error bars show the standard deviation (SD) with n = 3. Mutants W648F, W723F, W831A/F and W848A/F had Wt expression levels (p > 0.01), while all other mutants had lower expression levels (p < 0.005).
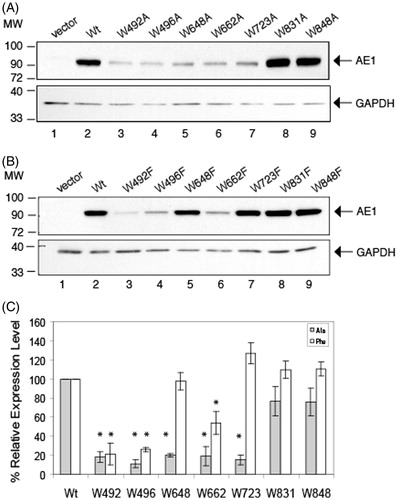
Figure 3. Immunolocalization of C-terminal His6-tagged AE1 and tryptophan mutants expressed in HEK cells. Intact cells expressing Wt (A) and tryptophan mutants (B, left: Ala substitution, right: Phe substitution) of AE1 were stained by a mouse monoclonal antibody (BRIC6), which detects an extracellular epitope on AE1. The cell surface expression was visualized as green by secondary Alexa 488 conjugated goat anti-mouse IgG in non-permeabilized cells (column 1). Total AE1 expression was visualized as red by secondary Cy3-conjugated goat anti-mouse IgG after cells were fixed and permeabilized (column 2). AE1 at the cell surface is displayed in yellow by merging the cell surface and total expression of AE1 (column 3). The mutants W648F, W662F, W723F, W831A/F and W848A/F showed detectable cell surface expression as indicated by yellow in the merged images, while the other mutants did not show cell surface expression. Wt AE1 and all the mutants showed intracellular localization (red). (In the black and white version of this figure, the yellow colour is seen as bright.)
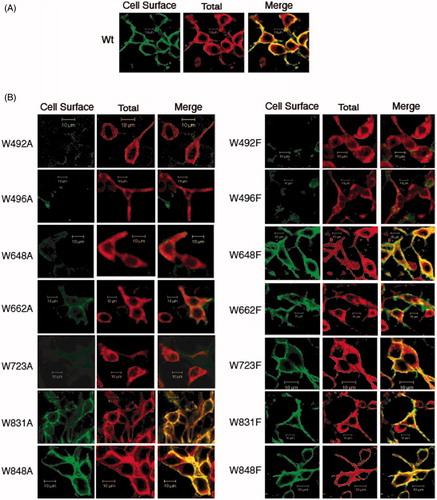
Figure 4. Cell surface biotinylation of C-terminal His6-tagged AE1 and tryptophan mutants expressed in HEK cells. Cells cultured in six-well plates were transfected with 1 μg cDNA per well and the cells were biotinylated with 0.5 mg/ml NHS-SS-biotin reagent in borate buffer for 30 min. Whole-cell lysates solubilized in RIPA buffer were incubated with streptavidin-agarose beads to capture biotinylated proteins. Total AE1 (lane T), unbound to streptavidin beads (lane U), and bound AE1 at five times concentrated the amount loaded relative to total AE1 (lane B) were detected by immunoblotting using a mouse monoclonal anti-AE1 antibody. Endogenous GAPDH was detected using a mouse monoclonal anti-GAPDH to confirm that biotinylation only occurred at the cell surface. Control (A) represents AE1-expressing cells mock-treated without biotinylation reagent, while Wt represents cells treated with biotinylation reagent. Monomeric (open circle) and oligomeric forms (closed circle) of AE1 are indicated (A, B). Panel (C) shows percent cell surface biotinylation of Wt AE1 and Trp mutants (dark bar: Ala substitutions) light gray bar: Phe substitutions) in three independent transfection experiments. Monomeric and higher oligomeric bands were indicated in the quantification. The error bars show the standard deviation (SD) with n = 3. The W648F, W662F, W723F, W831A/F and W848A/F mutants showed biotinylation levels similar to Wt AE1 (p > 0.05), while the other mutants have lower biotinylation levels (p < 0.05).
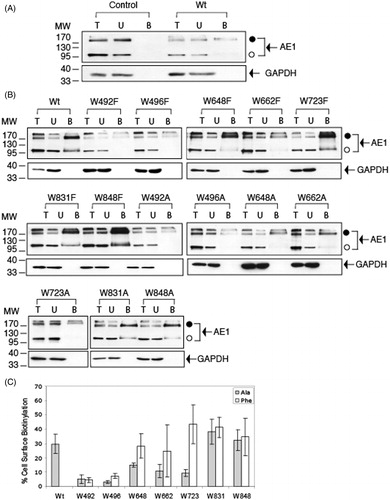
Figure 5. SITS-AffiGel binding of C-terminal His6-tagged AE1 and tryptophan mutants expressed in HEK cells. Cells grown in six-well plates were transfected with 1 μg cDNA per well and were solubilized in 1% C12E8 after 48 hours growth. The total cell lysates (T) were incubated with SITS-AffiGel resin in the absence (B) or presence (D) of 1 mM H2DIDS, a competitive inhibitor of SITS binding. After removing the extract and washing the beads, the bound proteins on the SITS-Affi-Gel beads were eluted with SDS sample buffer. Immuno-blot analysis on the eluants was performed using a mouse monoclonal anti-AE1 antibody. Vector (A) is a control transfection with empty vector pcDNA3. The position of molecular weight markers are shown on the left. Panel (C) shows the percent SITS-Affi-Gel binding 100% × (B-D)/T of Wt AE1 and the Trp mutants (dark bar: Ala substitutions, light gray bar: Phe substitutions) in three independent transfection experiments. The error bars show the standard deviation (SD) with n = 3. The mutants W648F, W662F and W723F, W831A/F and W848A/F showed SITS binding levels similar to Wt AE1 (p > 0.05), while the other mutants showed diminished binding (p < 0.05).
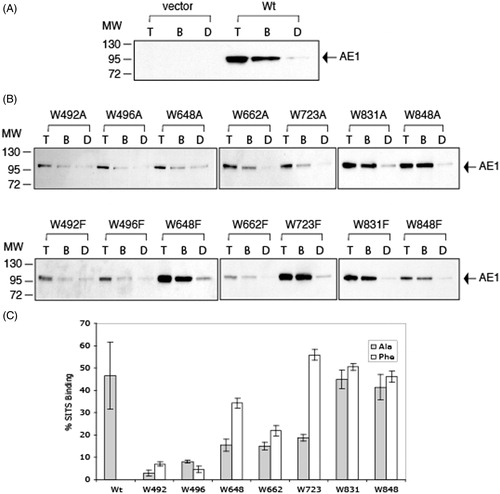
Figure 6. Anion transport assays of C-terminal His6-tagged AE1 and tryptophan mutants expressed in HEK cells. Cells grown on cover slips in 60 mm tissue culture dishes were transfected with 1.6 μg cDNA per dish and incubated for 48 hours. The pH-sensitive dye BCECF-AM was loaded into cells and intracellular pH was measured by fluorescence at excitation wavelengths 440 and 502 nm and emission wavelength at 529 nm. The Figure shows the rate of intracellular pH change per sec for an average of three separate transfections. pcDNA vectors and Wt AE1 were used as negative and positive controls, respectively. The transport activities of the tested Trp mutants were all above vector controls and were not significantly different from the Wt-His tagged construct. The transport activity of mdAE1 was also tested and was found to retain functional activity.
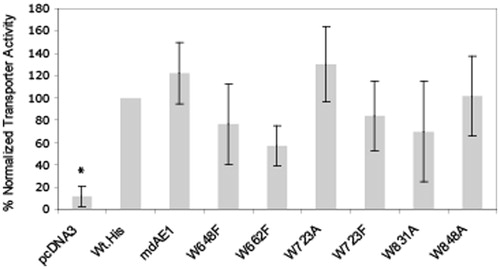
Figure 7. Immunoblot showing N-glycosylation analysis of AE1, kAE1 and mdAE1 expressed in transfected HEK cells. AE1 (lanes 1–3), kAE1 (lanes 3–6), mdAE1 (lanes 7–7 and 7′–9′). The panel on the right is a longer exposure of mdAE1. Detergent solubilized cell extracts were subjected to glycosidase digestion (C; control, H: endoglycosidase H, F: PNGase F). Immunoblot analysis was performed as described in . The positions of molecular weight markers are shown on the left. AE1 ran as a single predominant band, kAE1 ran as a major lower band with higher molecular weight bands and mdAE1 ran as a lower band and a series of higher molecular weight bands. In all cases the lower band (o) contained high mannose oligosaccharide that was sensitive to endoglycosidase H to produce a non-glycosylated band (x), while the upper bands contained complex oligosaccharides that were resistant to endoglycosidase H but could be removed by PNGaseF (indicated by the brackets).
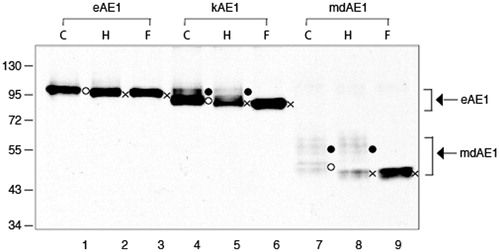
Table 1. Percent complex oligosaccharide in erythrocyte anion exchanger 1 (AE1), kidney anion exchanger 1 (kAE1) and membrane domain of anion exchanger 1 (mdAE1) containing different tags expressed in HEK-293 cell.
Figure 8. Immunolocalization of AE1, kAE1 and mdAE1 in transfected HEK cells was performed described in . Cell surface expression of AE1, kAE1 and mdAE1 in intact cells was visualized as green, total expression in permeabilized cells was visualized as red and the overlap in yellow. All proteins could be detected at the cell surface (yellow) as well as intracellularly (red). (In the black and white version of this figure, the yellow colour is seen as bright.)
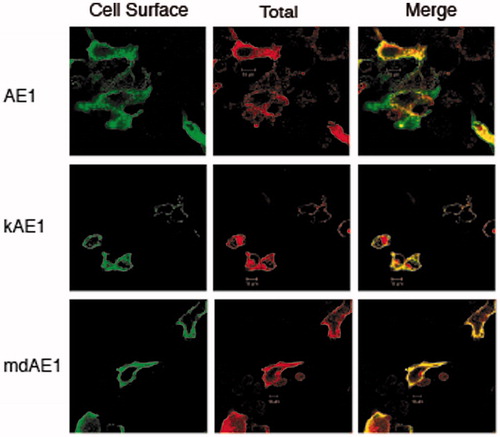
Figure 9. Immunoblot analysis of N-glycosylation processing of C-terminal His6-tagged mdAE1 and tryptophan mutants expressed in transfected HEK cells. Immunoblot analysis was performed as described in . The positions of molecular markers are shown on the left. Arrows at the left between molecular weight of 72 000 and 55 000 in (A, B) denote a non-specific band that also appears in the vector control. Wild-type mdAE1 ran as a lower molecular weight band and a series of higher molecular weight bands as did W723F, W831A/F and W848A/F. The other mutants were expressed at diminished levels and ran as a lower band. (C) Immunoblot analysis of N-glycosylation processing of C-terminal His6-tagged membrane domain (mdAE1) after purification by Ni-affinity chromatography. Note the absence of the non-specific band. Wild-type mdAE1 ran as a lower molecular weight high-mannose band and a series of higher molecular weight complex bands as did W723F, W831A/F and W848A/F. Mutants W648A/F and W662F showed a major lower band with small amounts of upper bands while the other mutants only showed the lower band. Panel (D) shows the percent complex oligosaccharide of the Trp mutants (dark bar: Ala substitutions, light gray bar; Phe substitutions) determined by scan of the immunoblots of His6-tagged proteins purified by Ni-affinity chromatography in three independent transfection experiments. The error bars show the standard deviation (SD) with n = 3. W723F, W648F, W662F, W831A/F and W848A/F were comparable to Wt mdAE1 (p > 0.01).
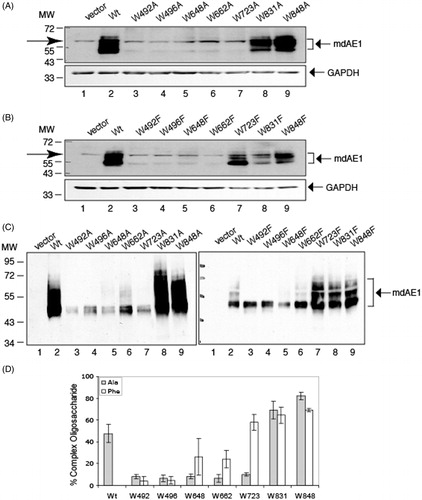
Figure 10. Immunolocalization of C-terminal His6-tagged mdAE1 (A) and tryptophan mutants (B) expressed in HEK cells was performed as described in . Cell surface expression of mdAE1 in intact cells was visualized as green, total mdAE1 expression in permeabilized cells was visualized as red, and the overlap representing cell surface mdAE1 was visualized in yellow. The mdAE1 mutants W648A/F, W662A/F, W723A/F, W831A/F and W848A/F all showed cell surface expression, while W492A/F and W496A/F did. Wt mdAE1 and all mutants also showed intracellular localization. (In the black and white version of this figure, the yellow colour is seen as bright.)
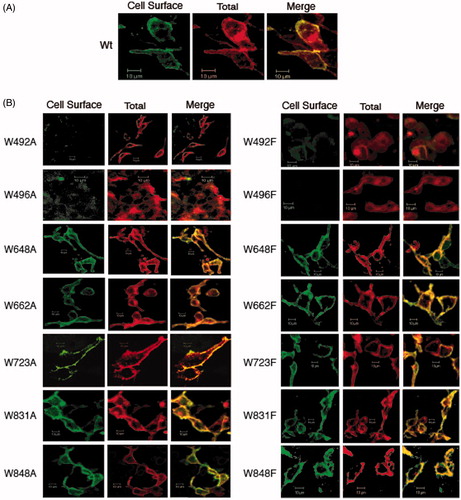
Table 2. Summary of AE1 and mdAE1 tryptophan mutageneis studies in transfected HEK-293 cells*.