Figures & data
Figure 1. Aromatic/arginine (ar/R) constriction of primarily water-conducting aquaporins. (A) Ribbon representation of an AQP monomer based on the X-ray crystal structure of Pichia pastoris AQY1 (PDB: 3ZOJ). Oxygen atoms of water molecules are shown as spheres. (B) Close-up of the selectivity filter of the same AQP monomer. Its two half-helices are outlined, the NPA motifs and the ar/R constriction’s arginine and histidine are depicted in stick representation, the latter including hydrogen atoms. Two interlocking pairs of water molecules in the constriction are shown simultaneously. (C) Extracellular view of the ar/R constriction of the water-selective bovine AQP1 (PDB: 1J4N, Sui et al. Citation2001). The numbering is that of the rat AQP1 used in our experiments. (D) Model of the ar/R constriction of the water- and ammonia-permeable human AQP8, based on the crystal structure of bovine AQP1.
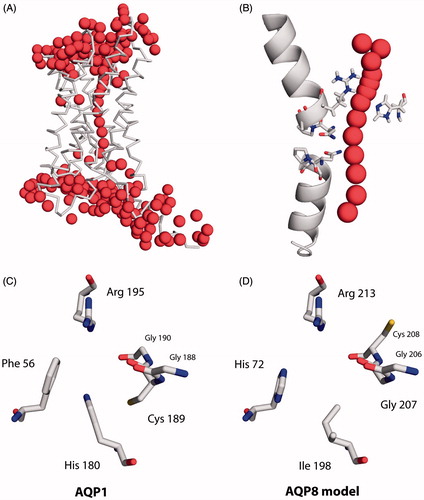
Figure 2. Apparent ammonia and methylammonia permeability of rAQP1 mutants. (A) Yeast transformants lacking all three ammonium transporters Mep1-3, as well as the endogenous aquaglyceroporin Fps1 (31019b fps1Δ), were grown at 29 °C in liquid medium containing ammonium as the only nitrogen source (NH4+ 40 mM, pH 6.9). Growth was detected turbidimetrically (OD420-580 nm) and evaluated by calculating areas under curves (AUC48 h, dashed lines indicate the limits used). Four sample growth curves are shown. (B) Average AUC48h (n = 4) for the first set of rAQP1 mutants. The grey line denotes the value for yeast transformants producing no AQP. (C) As in B, with ammonium replaced by glutamine. (D) Presence of rAQP1 mutants in 31019b fps1Δ transformants was verified by SDS-PAGE and Western blotting. (E) Yeast transformants lacking the endogenous aquaglyceroporin Fps1 (BY4742 fps1Δ) were grown at 29 °C in liquid medium containing a toxic amount of methylammonium (MA, 10 mM, pH 5.5). The major nitrogen source was 8.7 mM proline. (F) Average AUC48 h (n = 4) for the first set of rAQP1 mutants. (G) As in F, with no methylammonium. Error bars denote SD, referring to the number of yeast cultures. Please note the varying ordinate scales.
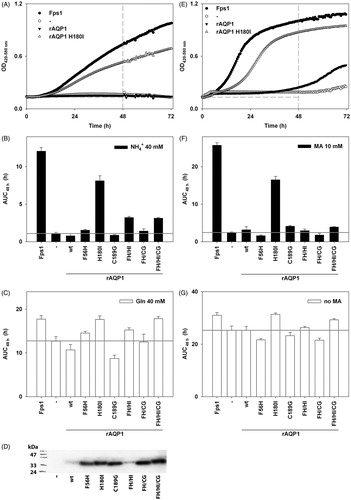
Figure 3. Water permeability of rAQP1 mutants as determined with yeast sphaeroplasts. (A) Sphaeroplasts were subjected to a hyperosmotic sorbitol gradient (150 mM, tonicity increase of ∼11%), and their shrinkage was followed by measuring light scattering at 20 °C. Three normalized average curves are shown (n = 9–11). The yeast strain in this example was 31019b fps1Δ. The horizontal line marks the ordinate value at which the nominal relaxation time (τ) was read. (B) Inverse nominal relaxation times (τ−1) of sphaeroplast shrinkage (n = 3–11). Data obtained with both yeast strains (31019b fps1Δ and BY4742 fps1Δ). The grey line marks the smallest value. (C) Mercuric chloride inhibition of rAQP1 mutants. BY4742 fps1Δ sphaeroplasts were incubated with 25 μM HgCl2 for at least 10 min. τ−1 ratios are shown, with values below 1 indicating inhibition (n = 3–7). Error bars denote SD, referring to the number of individually evaluated curves. No error is shown for rAQP1 (n = 2). Yeast transformants were from the same frozen stocks as those used in the ammonia and methylamine assays shown in .
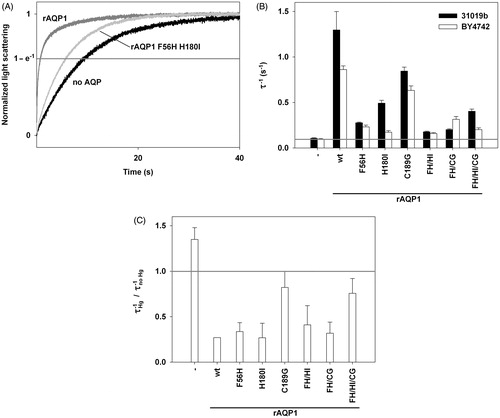
Figure 4. Aromatic/arginine constrictions of water-selective rAQP1 and its methylamine-permeable rAQP1 mutant H180I. Extracellular view, spacefilling representation based on the crystal structure of bovine AQP1 (PDB: 1J4N).
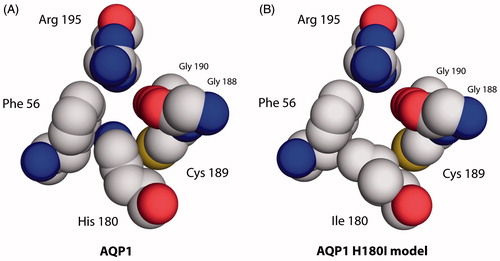
Figure 5. Apparent ammonia and methylammonia permeability of rAQP1 mutants. (A) Yeast transformants lacking all three ammonium transporters Mep1-3, and the endogenous aquaglyceroporin Fps1 (31019b fps1Δ), were grown at 29 °C in liquid medium containing ammonium as the only nitrogen source (NH4+ 40 mM, pH 6.9). Growth was detected turbidimetrically (OD420–580 nm) and evaluated by calculating areas under curves (AUC 48 h, dashed lines indicate the limits used). Four sample growth curves are shown. (B) Average AUC48 h (n = 4) for the second set of rAQP1 mutants. The grey line denotes the value for yeast transformants producing no AQP. (C) As in B, with ammonium replaced by glutamine. (D) Presence of rAQP1 mutants in 31019b fps1Δ transformants was verified by SDS-PAGE and Western blotting. Please note that preperations of AQP-deficient, rAQP1 wild-type and H180I-producing yeast were different from those shown in . (E) Yeast transformants lacking the endogenous aquaglyceroporin Fps1 (BY4742 fps1Δ) were grown at 29 °C in liquid medium containing a toxic amount of methylammonium (MA, 10 mM, pH 5.5). The major nitrogen source was 8.7 mM proline. (F) Average AUC48 h (n = 4) for the second set of rAQP1 mutants. (G) As in F, with no methylammonium. Error bars denote SD, referring to the number of yeast cultures. Please note the varying ordinate scales. Yeast growth data for Fps1, no AQP, rAQP1 and its mutant rAQP1 H180I is the same as that shown in .
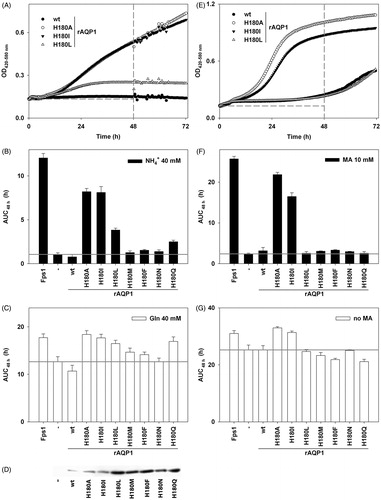
Figure 6. Water permeability of rAQP1 mutants as determined with yeast sphaeroplasts. (A) Sphaeroplasts were subjected to a hyperosmotic sorbitol gradient (150 mM, tonicity increase of ∼11%), and their shrinkage was followed by measuring light scattering at 20 °C. Three normalized average curves are shown (n = 8–11). The yeast strain in this example was 31019b fps1Δ. The horizontal line marks the ordinate value at which the nominal relaxation time (τ) was read. (B) Inverse nominal relaxation times (τ−1) of sphaeroplast shrinkage (n = 3–11). Data obtained with both yeast strains (31019b fps1Δ and BY4742 fps1Δ). The grey line marks the smallest value. (C) Mercuric chloride inhibition of rAQP1 mutants. BY4742 fps1Δ sphaeroplasts were incubated with 25 μM HgCl2 for at least 10 min. τ−1 ratios are shown, with values below 1 indicating inhibition (n = 3–9). Inhibition data for rAQP1 H180Q was obtained with strain 31019b fps1Δ (asterisk). Error bars denote SD, referring to the number of individually evaluated curves. No error is shown for rAQP1 and rAQP1 H180F (n = 2). Data for no AQP, rAQP1 and rAQP1 H180I is the same as that shown in . Yeast transformants were from the same frozen stocks as those used in the ammonia and methylamine assays shown in .
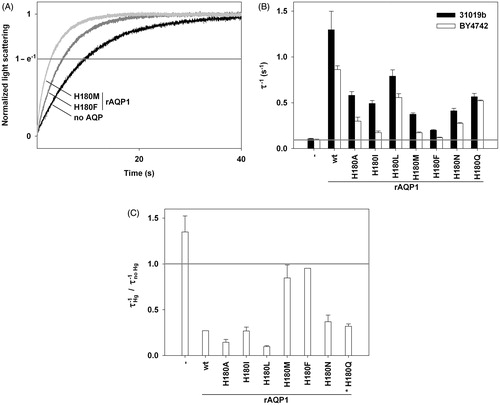
Figure 7. Effect of rAQP1 His180 substitution on water, methylamine and apparent ammonia permeability, as determined by real-time light scattering measurements with yeast sphaeroplasts (water) and long-term yeast growth assays (ammonia and methylamine). The spatial orientation of the amino acids is similar to that of the histidine shown in . Images were generated from the crystal structure of bovine AQP1 following mutation of His182 to the respective amino acid using the Swiss-PDB Viewer (PDB: 1J4N).