Figures & data
Figure 1. (A) CD kinetic study in DOPC vesicles. Plot color code: dark blue: CD spectrum recorded after 5 minutes, purple: CD spectrum recorded after 9 hours, green: CD spectrum recorded after 11 hours. (B) Time course of CD ellipticity at 200 nm. (C) Time evolution of the 1D 1H NMR spectra of hIAPP. Plot color code: dark blue: NMR spectrum recorded after 20 minutes; purple: NMR spectrum recorded after 4 hours; orange: NMR spectrum recorded after 8 hours; green: NMR spectrum recorded after 12 hours. (D) Time course of normalized integrals of NMR signal between 6.6 and 7.7 ppm. “This Figure is reproduced in color in the online version of Molecular Membrane Biology”.
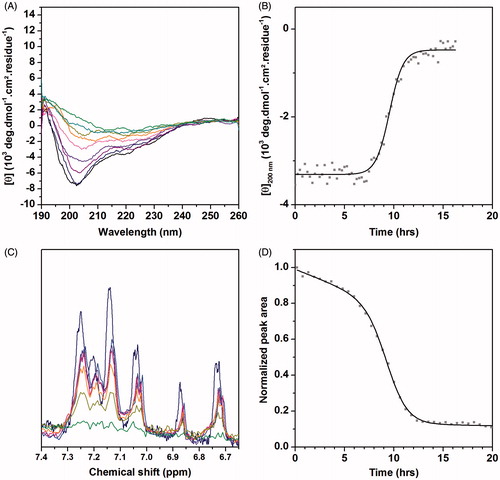
Table 1. Kinetic parameters of hIAPP β-sheet formation and monomer depletion in the different vesicles, determined using the time course of absolute CD ellipticity at 200 nm and by 1H NMR, respectively.
Figure 2. (A) CD spectra of hIAPP in the presence of DOPC/DOPS 8:2 and DOPC/DOPS/Chol 56:20:24 vesicles, t0.5 values are indicated in the insert. (B) Secondary structure content inferred from deconvolution of CD spectra at initial time and after 2 hours. “This Figure is reproduced in color in the online version of Molecular Membrane Biology”.
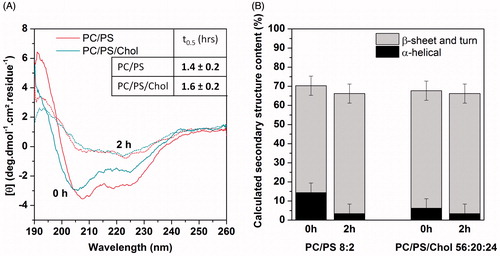
Figure 3. (A) Kinetics of hIAPP fibril formation in the presence of vesicles of different compositions. (B to G) Negatively stained microscopy images of hIAPP after incubation with vesicles of different compositions: (B) DOPC/Chol 10:0, (C) DOPC/Chol 9:1, (D) DOPC/Chol 8:2, (E) DOPC/Chol 7:3, (F) DOPC/DOPS 8:2, (G) DOPC/DOPS/Chol 56:20:24. “This Figure is reproduced in color in the online version of Molecular Membrane Biology”.
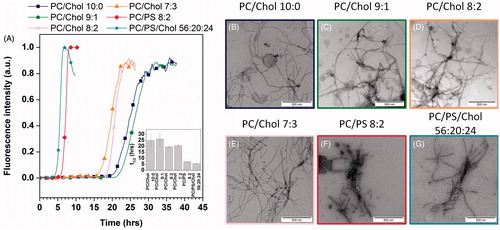
Figure 4. (A) Membrane permeabilization induced by hIAPP on vesicles of different compositions. (B) Representation of the lag time of fibril formation experiments and membrane permeabilization experiments. “This Figure is reproduced in color in the online version of Molecular Membrane Biology”.
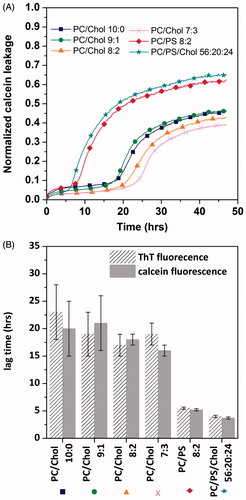
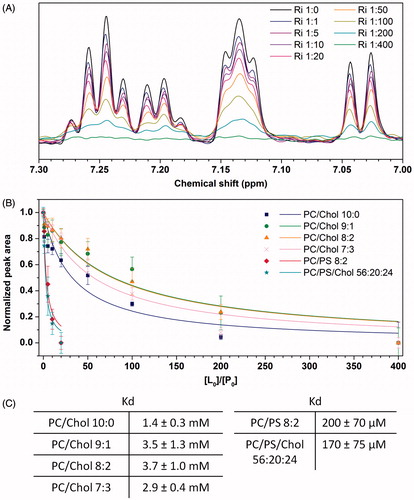
Figure 5. (A) 1H NMR spectra of hIAPP in the absence and in the presence of different concentrations of DOPC vesicles. (B) Experimental NMR data and their corresponding fit for different vesicles compositions. (C) Dissociation constant Kd of hIAPP for different vesicles compositions. “This Figure is reproduced in color in the online version of Molecular Membrane Biology”.